Figure 1
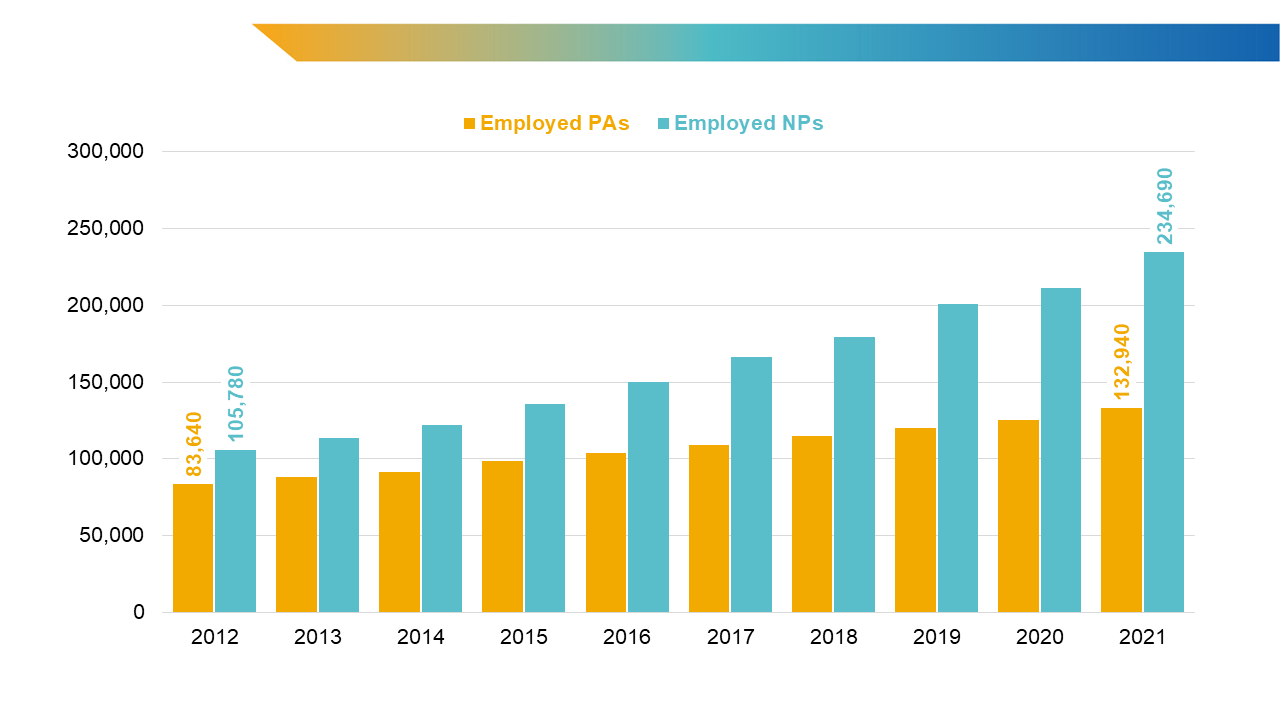
Figure 1. Growth in employed PAs and NPs, 2012-2021.
Sources: Bureau of Labor Statistics. National Occupational Employment and Wage Estimates, May 2012-May 2021. Accessed July 20, 2023. https://www.bls.gov/oes/
Figure 1 Overview
The figure contains a bar chart that shows the growth in employed physician assistants (PAs) and nurse practitioners (NPs) in the United States from 2012 to 2021. It shows that both NP and PA workforces have grown across each year. The number of employed NPs is higher than the number of employed PAs from 2012 to 2021. Employed NPs have more than doubled, while the number of employed PAs have increased at a slower rate.
Figure 1 Values
| Year | Employed PAs | Employed NPs |
|---|---|---|
| 2012 | 83,640 | 105,780 |
| 2013 | 88,110 | 113,370 |
| 2014 | 91,670 | 122,050 |
| 2015 | 98,470 | 136,060 |
| 2016 | 104,050 | 150,230 |
| 2017 | 109,220 | 166,280 |
| 2018 | 114,710 | 179,650 |
| 2019 | 120,090 | 200,600 |
| 2020 | 125,280 | 211,280 |
| 2021 | 132,940 | 234,690 |
Figure 1 Presentation
The bar chart represents employment growth trends of PAs and NPs in the United States. from the years 2012 to 2021. The x-axis represents the years 2012 through 2021 from left to right. The y-axis represents the number of employed PAs and NPs, ranging from 0 to 300,000 from bottom to top. Employment growth of PAs and NPs is represented for each year by two bars from left to right: Employed PAs (gold) and Employed NPs (teal).
Figure 2
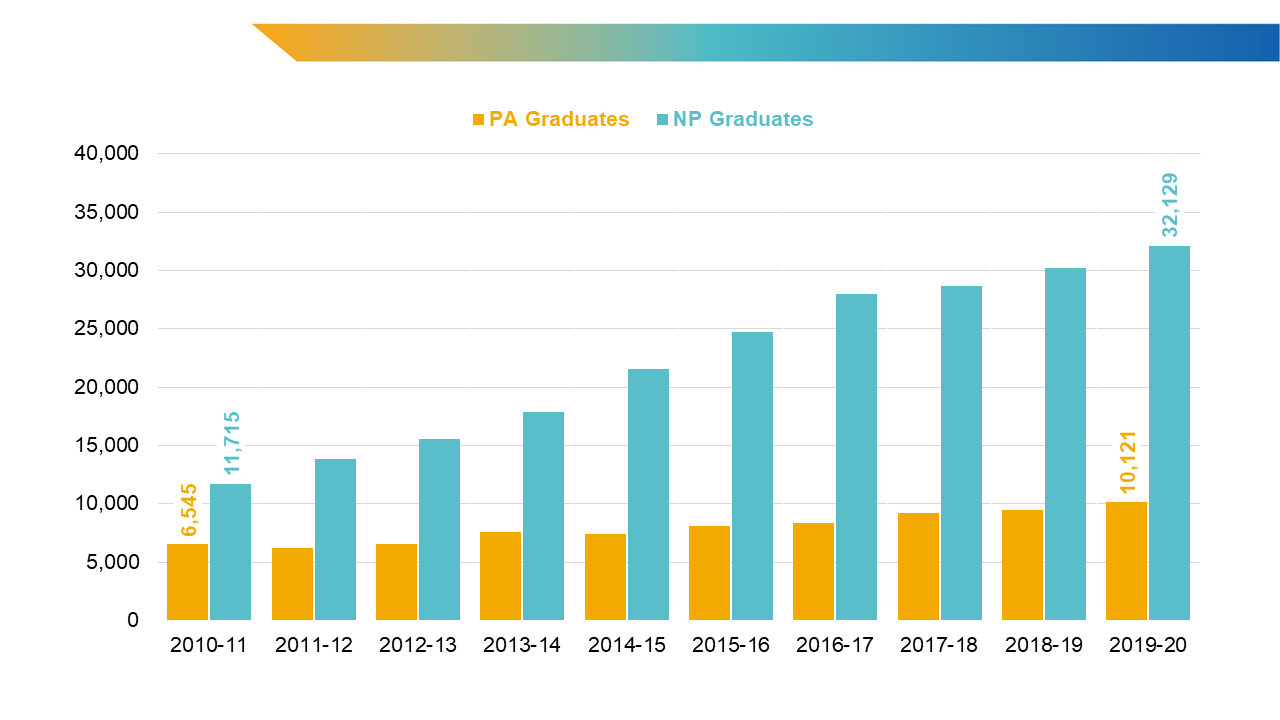
Figure 2. Growth in PA and NP graduates, 2010-2020.
Figure 2 Overview
The figure contains a bar chart that shows the growth in PA and NP graduates in the United States from 2010 to 2020. It shows that the production of new PAs and NPs has increased in the past decade. The number of PA graduates increased by more than 3,000 from 2010 to 2020, and the number of NP graduates more than doubled (an increase of more than 24,000).
Figure 2 Values
| Year | PA Graduates | NP Graduates |
|---|---|---|
| 2010-11 | 6,545 | 11,715 |
| 2011-12 | 6,225 | 13,809 |
| 2012-13 | 6,508 | 15,571 |
| 2013-14 | 7,556 | 17,840 |
| 2014-15 | 7,394 | 21,506 |
| 2015-16 | 8,081 | 24,757 |
| 2016-17 | 8,336 | 27,967 |
| 2017-18 | 9,202 | 28,700 |
| 2018-19 | 9,446 | 30,161 |
| 2019-20 | 10,121 | 36,000 |
Figure 2 Presentation
The bar chart represents growth trends of new PA and NP graduates in the United States from 2010 to 2020. The x-axis represents the years 2010 through 2020 from left to right. The y-axis represents the number of new PA and NP graduates, ranging from 0 to 40,000 from bottom to top. Growth of new PA and NP graduates is represented for each year by two bars from left to right: PA Graduates (gold), and NP Graduates (teal).