The mission of value-based care (VBC) is to link health care payments to the quality of care patients receive. The goal is to change the financial incentives of the dominant fee-for-service system that pays health care providers more for doing more rather than for doing better. While most agree that “value” in health care must combine both cost and quality, debates about exactly what “value” means and how it is measured have occupied policymakers for decades.
Since 2010, federal policymakers have invested billions of dollars in the Center for Medicare and Medicaid Innovation (CMMI), which tests VBC models that aspire to both increase quality of care and decrease health care costs.1 Physicians, clinics, and hospitals throughout the nation have piloted these VBC models, investing their time and resources into fulfilling the goal of providing the right care, to the right patient, at the right time. They have developed new programs, extended their hours, hired new staff, implemented new technology, tracked outcomes in registries, and linked their own finances to the success or failure of the quality of care they provide. This brief asks the question: What do we have to show for it?
Unsurprisingly, the answer to whether VBC “works” depends on who you ask. The physician whose clinic has taken on the work — and the financial risk — of providing care under the new models? The policymaker responsible for saving Medicare dollars? The patient who got the cancer screening and treatment they needed, ideally without having to be aware of how their physician was paid?
The promise of VBC is predicated on prevention, by helping patients avoid new conditions and manage existing ones through individual outreach and population health initiatives. Prevention is difficult to measure because it is difficult to identify negative outcomes that were avoided, and the benefits take time to materialize and may not produce short-term savings. This makes it hard to quantify the benefits of prevention in a single fiscal year or even a five-year pilot — and, as a result, paying for prevention has rarely been built into payment policy.
VBC was originally seen by many as a silver bullet for both quality and cost, but rigorous evaluations over the past decade have shown that VBC’s results are nuanced. While only a few large-scale VBC models have demonstrated reduced health care costs, many have improved quality — which is arguably more important to patients and their loved ones and the clinicians that care for them. However, most policymakers and payers have prioritized the potential for cost savings rather than quality improvement or population health, an emphasis echoed in the independent evaluations and academic literature.
This paper explores several types of VBC models that have had positive impacts on cost and quality:
- Population-based payments, which include:
- Accountable Care Organizations
- Capitated payments
- Episodic payments
We focus on these categories because they encompass a broad array of patient populations and have the potential to affect health care delivery at scale. We assess which large-scale VBC models have worked so far, what gaps exist in the current portfolio, and what opportunities exist to build on VBC’s promise of better care at a lower cost for patients. We also summarize CMMI’s net savings and losses for the VBC models discussed in this paper (Figure 1). We find that some VBC models have achieved net savings, while others have resulted in relatively modest net spending — which may be a reasonable investment in quality improvement.
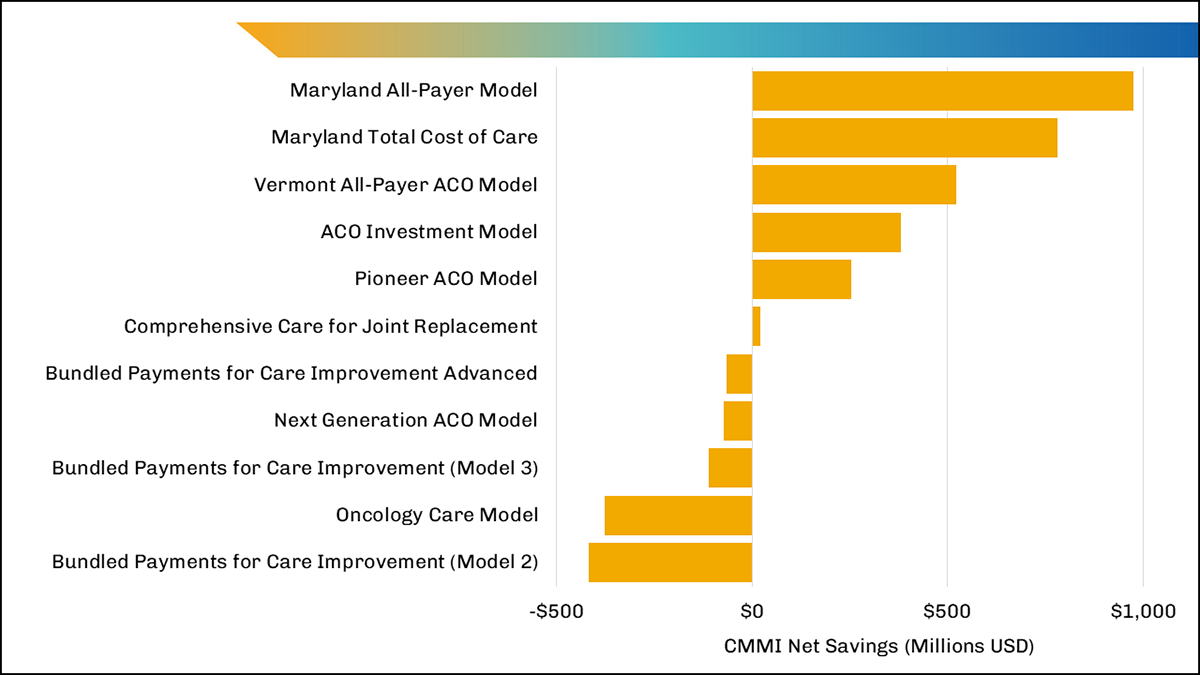
Figure 1. Net savings for CMMI value-based care models
The figure shows Centers for Medicare & Medicaid Services (CMS) net savings and losses for the CMMI models discussed in this article, with savings shown as positive values and losses as negative values. For each model, the data were taken from the most recent independent evaluations with savings estimates and represent cumulative savings, as cited in this article. Each model has a unique duration, and the data across models range from 2012 to 2022. Results for Bundled Payments Care for Improvement were reported separately for two tracks (Model 2 and Model 3). The net savings and losses in this figure were not statistically significant for three models: Vermont All-Payer Accountable Care Organization (ACO), Comprehensive Care for Joint Replacement, and Bundled Payments for Care Improvement Advanced. The Medicare Shared Savings Program (MSSP) is not included in this figure because formal evaluations of MSSP, as a permanent CMS program, and of CMMI models do not have comparable methodologies.
What Has Worked So Far in Value-Based Care?
Population-Based Payments
Accountable Care Organizations
Accountable Care Organizations (ACOs) are among the most successful VBC models to date.2-4 Most ACO models involve a provider taking financial responsibility for their patient population’s total cost of care and addressing key quality measures over the course of a year. Nearly all ACO models include the opportunity for shared savings between providers and payers, and many are structured to share financial losses as well. To date, all Medicare ACO models are voluntary for the hospitals and physicians that choose to participate.
Several ACO models have achieved significant cost savings driven by reductions in avoidable utilization such as preventable inpatient admissions and emergency department (ED) visits, including:
- The Medicare Shared Savings Program (MSSP), which achieved $1.66 billion in savings in 2021, according to projections by the Centers for Medicare & Medicaid Services (CMS). This represented the fifth consecutive year that MSSP achieved Medicare savings. While both hospital- and physician-led ACOs achieved savings, those led by physicians had higher average savings, as did ACOs that shared in both savings and losses.5-7 MSSP is the largest ACO model in the United States and is operated by CMS as a permanent program.
- The Pioneer ACO Model, which achieved $254 million in significant net savings from 2012 to 2013 relative to MSSP. Pioneer ACOs achieved these savings through reductions in inpatient admissions, ED visits, and post-acute care (PAC) utilization. Patients also reported better experiences with timely care, provider communication, and shared decision-making. As a result, elements of the Pioneer ACO Model were incorporated into MSSP to strengthen the permanent program.2,8
- The ACO Investment Model (AIM), which also had significant net savings of $381.5 million from 2016 to 2018, relative to MSSP, driven by reduced admissions, readmissions, ED visits, and PAC.9,10 Under AIM, CMMI provided upfront funding to ACOs serving rural and underserved populations, which the ACO paid back through its portion of shared savings. In 2023, elements of AIM were made permanent under MSSP.11,12
Other ACO models have not achieved net savings for CMS, including:
- The Next Generation ACO Model, which achieved gross but not net savings for CMS from 2016 to 2021, after accounting for shared savings to participants. Despite the lack of net savings, the model reduced key spending and utilization measures for acute care, professional services, and PAC across all five years, with the greatest impact in the final year of the model.13,14
- The Vermont All-Payer ACO Model, which achieved significant net savings for the state of Vermont in the first two years of the model (from 2017 to 2019). CMMI also achieved significant gross savings during this period, but the positive net savings were not statistically significant.15,16 This model continued through 2022, and future evaluations may find significant net savings for CMMI.
Research reinforces the findings that many ACOs have improved quality and reduced costs. One recent systematic review concluded that ACOs in both the public and private sectors have reduced costs without reducing quality, with savings driven by reductions in outpatient spending and in low-value services.17 A second systematic review found that the most consistent ACO outcomes across payers were reductions in inpatient and ED use and quality improvements in preventive care and chronic disease management.18 In addition, researchers have found it takes time for VBC models to deliver these results. For example, MSSP participants achieved greater cost savings after three years in the program than after one or two years.6 While both systematic reviews found mixed evidence, the fact that multiple ACO models have achieved cost savings and quality improvement at scale creates a solid foundation for future VBC efforts based on a population health approach.
Capitated Payments
Building on ACOs, more recent population-based payments have been designed to include capitation. Capitation involves fixed payments to hospitals, health systems, or physicians for delivering care either linked to the number of patients they serve or as a flat amount per provider. Despite the limited number of capitation-based models to date — and limited interest among individual providers to take on this level of risk, due in part to the backlash against health management organizations (HMOs) in the 1990s19 — CMMI has expressed an interest in developing specialty-based models that include capitation.20
In 2021, CMMI began testing the Direct Contracting Model, an ACO model that included full or partially capitated payments for patients in specified geographic regions. In 2023, this model was relaunched as the ACO Realizing Equity, Access, and Community Health (REACH) Model.21 To date, no evaluations are available for either Direct Contracting or ACO REACH. Evaluation results are available for several large-scale CMMI models that feature capitation, however, including:
- The Primary Care First (PCF) Model, which includes monthly capitated payments for patients assigned to a provider, in combination with additional revenue for the primary care visits delivered to these patients (set at a fixed dollar amount per visit). The capitated payments are tied to primary care practices’ performance on preventive care measures, patient satisfaction, and health care utilization.22 The first PCF evaluation found that the capitated payments were about 20% higher than fee-for-service payments, supporting the practices’ investments in enhanced primary care. Future evaluations will assess the model’s impact on quality and utilization.23,24 PCF builds on two earlier primary care models, Comprehensive Primary Care (CPC) and CPC Plus (CPC+), which offered extra care management payments to patient-centered medical homes (and did not feature capitation). Both CPC and CPC+ reduced inpatient and ED utilization, but neither decreased costs, and CPC+ significantly increased net costs when care management payments to participants were taken into account.2,25-27
- The Maryland Total Cost of Care (MTCC) Model, which sets a fixed, per capita limit on health care spending in Maryland. From 2018 to 2021, MTCC reduced net Medicare spending by $781 million. The state achieved this by reducing some forms of inpatient care — including potentially avoidable admissions and unplanned readmissions — and instead, providing increased outpatient care.28 In addition to setting fixed payments for all hospitals in the state, MTCC provides hospitals with options for partnering with other providers to improve quality without increasing overall Medicare costs. Finally, MTCC offers primary care practices the opportunity to participate in a program designed to mirror PCF.29
- The Maryland All-Payer Model achieved net Medicare savings of $975 million from 2014 to 2018, the largest savings to date of any CMMI model.3,30,31 The MTCC builds on the success of this model. However, while CMMI has achieved remarkable savings in Maryland, the unique history of Maryland’s Medicare payments makes this model difficult to replicate in other states.
Capitation is intriguing for both public and private payers because it allows the insurers to offload most or all the financial risk to providers, while the payers keep a slice of the total cost of care to cover administrative services. This makes capitation a scary prospect for many providers, however. To be willing to take on this degree of financial risk, providers must believe the capitated payments and the associated quality measures are directly related to clinical decisions in their control.
Episodic Payments
Episodic payments involve time-limited responsibility for patients who have specific conditions or procedures. Episodes, including procedures, acute medical conditions, and chronic conditions, typically involve specialists and are sometimes organized around service lines. In recent years, most CMMI models have included 90-day episodes during which providers are accountable for patients’ total cost of care, with the opportunity for both shared savings and shared losses. While most episodic payment models have been voluntary to date, CMMI has indicated that future models are likely to be mandatory.32,33
Several episodic payment models have resulted in gross savings, and one has achieved net savings for surgical episodes, including:
- The Comprehensive Care for Joint Replacement (CJR) Model has been the most successful bundled payment model to date from CMS’s perspective. From 2016 to 2019, CJR achieved $21.5 million in net savings.2,34,35 While this finding wasn’t significant, CMS has extended the model through 2024 in hopes that additional time and methodology changes will result in significant Medicare savings.3,36 In addition, CMS believes CJR’s mandatory participation reduces selection bias and increases the accuracy of the evaluation of the model.20 As the only mandatory bundled payment program to date, CJR is likely to serve as CMMI’s primary example for future model design.
- The Bundled Payments for Care Improvement (BPCI) Model from 2013 to 2018 included both medical and surgical conditions. While the model achieved gross savings, CMS had significant net losses overall after shared savings payments to hospitals were taken into account.22,37,38
- The BPCI Advanced (BPCIA) Model succeeded BPCI in 2018 and is ongoing. Like BPCI, the model has achieved gross savings. To date, surgical episodes within BPCIA have achieved significant net savings, but they were offset by losses on medical episodes in the model.2,39,40 CMMI has made numerous changes throughout the course of the model related to episode-selection policies, financial methodology, and quality measurement. One key change was to combine episodes into service lines rather than combining them as individual conditions, which may improve alignment for specialists and increase episode volume for CMMI. In addition, the COVID-19 pandemic disrupted the entire health care industry while this model was underway. As a result, CMS has extended the model through 2025 to allow more time to evaluate its impact.41
- The Oncology Care Model from 2016 to 2022 included patients with all cancer types treated by participating oncologists. The model achieved gross savings but net losses. The losses were due to care management payments to participants, which were used to redesign care delivery to be more person-centered and to align with appropriate clinical pathways.42,43 CMMI will be launching the successor Enhancing Oncology Model (EOM) in 2023 to continue its investment in oncology.44
Given the heterogenous conditions and procedures included in episodic payment models, it is possible that certain episode types are more likely to achieve cost and quality goals. For example, some BPCI researchers found that the most common surgical episodes (lower-extremity joint replacement and colectomy) achieved savings,45 while others found evidence that select medical episodes also achieved savings.46,47 As with ACOs, many researchers have also found evidence that savings increase with additional time in the program. For example, some researchers found that BPCI and BPCIA participants were more likely to achieve savings after two to three years in the model than after just one year.46-48 Given that most savings were due to reduced PAC use, it is likely this time was needed to build partnerships with PAC providers and redesign care transitions to deliver more appropriate care.
What Is Missing From VBC?
Health Care Equity
Health care equity is the largest gap in existing VBC models. In 2021, CMMI identified health equity as a key priority in their strategic plan for the coming decade, framing health equity as a core component of quality.32 To address this gap, CMMI committed to explicitly incorporating health equity into all future models. As of 2022, CMMI had begun this incorporation in ACO REACH and EOM by collecting data on patient demographics and health-related social needs, requiring participants to create health equity plans, and creating incentives for delivering care to underserved populations.12
Several key challenges remain for achieving health care equity in VBC models, including:
- Data on health-related social needs and patient demographics are lacking: To address patients’ unmet needs, the needs must first be identified. Many providers screen for health-related social needs and have developed referral networks to community resources to address them. For example, more than 95% of teaching hospitals reported screening for at least one social need, with screening rates higher than 90% for transportation access, food insecurity, housing instability, and intimate partner violence.49 In many cases, these data are integrated into the provider’s electronic health records, but they are not captured in the billing codes that payers can access. In addition, race and ethnicity data are rarely captured consistently by either payers or providers.50,51 As a result, it is hard to measure the impact of VBC models on health care equity for the patient populations they serve or to appropriately account for patients’ health-related social needs in the risk adjustment.52,53 In 2023, CMMI will begin to collect demographic data in ACO REACH and EOM, and the agency has announced its intention to collect social risk and demographic data in all future models.12
- Both rural and urban safety-net providers are underrepresented in CMMI VBC models: For example, when CMMI mapped PCF provider locations, the agency found that very few providers were located in historically red-lined neighborhoods in Detroit and Los Angeles.54 While there may be fewer providers practicing in these neighborhoods, this disparity may also indicate that the model itself contains implicit bias that results in fewer safety-net providers applying to participate in the CMMI VBC models. Similarly, few rural providers have participated in VBC models, except specialized models such as the AIM ACO.55 As a result, patients with higher health-related social needs are less likely to be included in VBC models, meaning that even if a VBC model can improve health care equity, it would not have an impact on the patient populations excluded from the outset.52 However, CMMI is seeking to engage more safety-net providers in future models and is exploring new ways to set financial benchmarks or provide startup funding to support these providers.51
- Benchmarking may be inappropriately low for underserved populations: In most VBC models, CMMI sets financial benchmarks based on historical spending by individual providers or within regions. However, this methodology may unintentionally exacerbate disparities for underserved populations, such as rural regions that experience lack of access to specialists or even to hospital care.52 If historical spending was inappropriately low, then VBC models centered on reducing costs would harm quality and access to care.51 Rural hospitals are more likely to run on slim margins and lack reserves, as higher rates of rural hospital closures indicate.56 Research has found that rural ACOs were more likely to exit MSSP when forced to take on financial risk, even for ACOs that had previously earned shared savings.57 Similarly, research shows that ACOs with higher proportions of patients in racial and ethnic minorities were also treating patients with greater medical complexity and disease severity without even accounting for nonclinical risk factors in the risk adjustment. As a result, these ACOs exited MSSP at higher rates than other providers.58
CMMI should continue to incorporate health care equity into current and future VBC models. However, its efforts must go beyond the current data collection, health equity plans, and incentive structures it has launched to date. Future VBC models should effectively engage safety-net providers and set appropriate benchmarks that reduce disparities, which may not leave room for cost savings for historically underserved populations. In addition, financial methodologies must appropriately account for patient risk — including both clinical factors and health-related social needs — to avoid penalizing providers who care for the highest-risk patients.
Clinical Outcomes
If a key purpose of VBC is to improve quality, its measurement must be prioritized. Most VBC models focus on utilization measures such as admissions, ED visits, and PAC use. Many include process measures related to cancer screening and other forms of preventive care. However, the only outcome measures included in most models are patient experience and mortality. Few models have assessed other clinical outcomes across a wide range of clinical conditions.2,18,21,59,60 BPCIA is a key exception as the first CMMI model to incorporate outcomes from clinical data registries.41 Still, even in the programs where outcomes are included, costs are prioritized.
Lack of granular, timely data — and a lack of understanding of how to use what we have — are primary limiting factors in measuring clinical outcomes and comparing them between entities.3 Addressing this gap is crucial and will require a multifaceted approach, including investments in data infrastructure, in systems that facilitate using the data effectively and in a timely fashion, and, in some cases, in developing new measures. The quality measures must also incorporate health care equity data to identify and close gaps in care. The data must be incorporated into risk adjustment to avoid penalizing providers who care for patients with the greatest health-related social needs.
Recognizing administrative and clinician burden is also crucial. While CMS and other payers judge programmatic success in terms of reductions in payments, there is no accounting of the dollars spent by clinicians, hospitals, and health systems to achieve the reductions or the dollars spent by CMS to administer the programs. Whether the enormous administrative efforts for VBC are truly producing value should take into account more than Medicare payments alone. Further, there has been little recognition of the impact of the additional burden on clinicians, particularly those in outpatient practice. It is likely that the requirements to collect and submit data, along with the financial risk from VBC programs, have contributed to the striking pattern of acquisition and consolidation in the health care industry over the past decade and, possibly, to clinician burnout. A successful VBC effort should aim to work with and for both clinicians and patients.
What Should Come Next in VBC?
While VBC has not proved to be a silver bullet for U.S. health care spending, several large-scale VBC models have delivered on the promise of modestly reducing cost while improving quality of care. Future VBC efforts in the public and private sectors should build on these successes with the understanding that one size will not fit all. For large practices, hospitals, and health care systems that can afford to take on financial risk, population-based payments have the most proven track record for cost-effectively treating patients with both acute and chronic conditions. However, finding additional savings may be contingent on providers having greater control over where patients assigned to a provider seek care. In contrast, episodic payments have engaged more specialists — especially for procedures and acute medical conditions — but savings have been elusive. This leaves a gap for chronic conditions treated primarily by specialists, which may present an opportunity to test capitated models over longer periods. But to ultimately achieve value for all, VBC must do a better job of incorporating health care equity and clinical outcomes, which are both key measures of quality, and of engaging patients and clinicians. Value must mean more than cost savings alone — quality should be central and is worth the price.
References
- KFF. “What is CMMI?” and 11 Other FAQs About the CMS Innovation Center. Washington, DC: KFF; 2018. https://www.kff.org/medicare/fact-sheet/what-is-cmmi-and-11-other-faqs-about-the-cms-innovation-center/. Accessed Nov. 7, 2022.
- U.S. Department of Health and Human Services, Centers for Medicare & Medicaid Services (CMS). Synthesis of Evaluation Results across 21 Medicare Models, 2012-2020. https://innovation.cms.gov/data-and-reports/2022/wp-eval-synthesis-21models. Accessed Nov. 7, 2022.
- Smith B. CMS Innovation Center at 10 years — progress and lessons learned. N Engl J Med. 2021;384(8):759-764. Published Feb. 25, 2021. https://doi.org/10.1056/NEJMsb2031138.
- U.S. Department of Health and Human Services, Centers for Medicare & Medicaid Services (CMS). The Center for Medicare and Medicaid Innovation 2022 Report to Congress. https://innovation.cms.gov/data-and-reports/2022/rtc-2022. Accessed Nov. 7, 2022.
- U.S. Department of Health and Human Services, Centers for Medicare & Medicaid Services (CMS). Medicare Shared Savings Program saves Medicare more than $1.6 billion in 2021 and continues to deliver high-quality care. https://www.cms.gov/newsroom/press-releases/medicare-shared-savings-program-saves-medicare-more-16-billion-2021-and-continues-deliver-high. Published Aug. 30, 2022. Accessed Nov. 7, 2022.
- McWilliams JM, Hatfield LA, Landon BE, Hamed P, Chernew, ME. Medicare spending after 3 years of the Medicare Shared Savings Program. N Engl J Med. 2018;379(12):1139-1149. https://doi.org/10.1056/NEJMsa1803388. Accessed Nov. 7, 2022.
- Verma S. Pathways to success: a new start for Medicare’s accountable care organizations. Health Affairs [blog]. Aug. 9, 2018. doi:10.1377/hblog20180809.12285. Accessed Nov. 7, 2022.
- L&M Policy Research, LLC. Pioneer ACO Final Report. Washington, DC: L&M Policy Research, LLC; December 2016. https://innovation.cms.gov/files/reports/pioneeraco-finalevalrpt.pdf. Accessed Nov. 7, 2022.
- Abt Associates. Evaluation of the Accountable Care Organization Investment Model. Rockville, MD: Abt Associates; 2020. https://innovation.cms.gov/data-and-reports/2020/aim-final-annrpt. Accessed Nov. 7, 2022.
- U.S. Department of Health and Human Services, Centers for Medicare & Medicaid Services (CMS). The ACO Investment Model final evaluation of three AIM performance years. https://innovation.cms.gov/data-and-reports/2020/aim-fg-finalannrpt. Accessed Nov. 7, 2022.
- U.S. Department of Health and Human Services, Centers for Medicare & Medicaid Services. Medicare and Medicaid Programs; CY 2023 Payment Policies Under the Physician Fee Schedule and Other Changes to Part B Payment and Coverage Policies; Medicare Shared Savings Program Requirements; Implementing Requirements for Manufacturers of Certain Single-dose Container or Single-use Package Drugs to Provide Refunds with Respect to Discarded Amounts; and COVID-19 Interim Final Rules. Washington, DC; Centers for Medicare & Medicaid Services; 2022. https://public-inspection.federalregister.gov/2022-23873.pdf. Accessed Nov. 18, 2022.
- U.S. Department of Health and Human Services, Centers for Medicare & Medicaid Services (CMS). Person-Centered Innovation — An Update on the Implementation of the CMS Innovation Center’s Strategy. Washington, DC: CMS; 2022. https://innovation.cms.gov/media/document/cmmi-strategy-implementation-update. Accessed Dec. 12, 2022.
- U.S. Department of Health and Human Services, Centers for Medicare & Medicaid Services (CMS). Next Generation Accountable Care Organization (NGACO) Model. Washington, DC: CMS; 2022. https://innovation.cms.gov/data-and-reports/2022/nextgenaco-fg-fifthevalrpt. Accessed Nov. 18, 2022.
- Lowell KH. Next Generation Accountable Care Organization (NGACO) Model Evaluation. Bethesda, MD: NORC at University of Chicago; 2022. https://innovation.cms.gov/data-and-reports/2022/nextgenaco-fifthevalrpt. Accessed Dec. 12, 2022.
- U.S. Department of Health and Human Services, Centers for Medicare & Medicaid Services (CMS). Vermont All-Payer Model (VTAPM) evaluation of the first two performance years: 2018-2019. https://innovation.cms.gov/data-and-reports/2021/vtapm-1st-eval-report-aag. Accessed Dec. 12, 2022.
- Loganathan S. Evaluation of the Vermont All-Payer Accountable Care Organization Model First Evaluation Report. Bethesda, MD: NORC at University of Chicago; 2021. https://innovation.cms.gov/data-and-reports/2021/vtapm-1st-eval-full-report. Accessed Nov. 18, 2022.
- Wilson M, Guta A, Waddell K, Lavis J, Reid R, Evans C. The impacts of accountable care organizations on patient experience, health outcomes and costs: a rapid review. J Health Serv Res Policy. 2020;25(2):130-138. https://doi.org/10.1177/1355819620913141. Accessed Nov. 7, 2022.
- Kaufman BG, Spivack BS, Stearns SC, Song PH, O'Brien EC. Impact of accountable care organizations on utilization, care, and outcomes: a systematic review. Med Care Res Rev. 2019;76(3):255-290. https://doi.org/10.1177/1077558717745916.
- Lesser CS, Ginsburg PB, Devers KJ. The end of an era: what became of the "managed care revolution" in 2001? Health Serv Res. 2003;38(1 Pt 2):337-355. https://doi.org/10.1111/1475-6773.00119.
- Fowler L, Rawal P, Fogler S, Waldersen B, O’Connell M, Quinton J. The CMS Innovation Center’s strategy to support person-centered, value-based specialty care. CMS.gov [blog]. Published Nov. 7, 2022. https://www.cms.gov/blog/cms-innovation-centers-strategy-support-person-centered-value-based-specialty-care.
- U.S. Department of Health and Human Services, Centers for Medicare & Medicaid Services (CMS). Accountable Care Organization (ACO) Realizing Equity, Access, and Community Health (REACH) Model. Baltimore, MD: CMS; 2022. https://www.cms.gov/newsroom/fact-sheets/accountable-care-organization-aco-realizing-equity-access-and-community-health-reach-model. Accessed Nov. 18, 2022.
- U.S. Department of Health and Human Services, Centers for Medicare & Medicaid Services (CMS). Primary Care First model options. Dec. 6, 2022. https://innovation.cms.gov/innovation-models/primary-care-first-model-options. Accessed Dec. 8, 2022.
- U.S. Department of Health and Human Services, Centers for Medicare & Medicaid Services (CMS), Center for Medicare and Medicaid Innovation. Findings at a Glance: Primary Care First (PCF) Model evaluation of the first year. 2021. https://innovation.cms.gov/data-and-reports/2022/pcf-first-eval-aag-rpt. Accessed Dec. 12, 2022.
- Conwell L, Powell R, Machta R, et al. Evaluation of the Primary Care First Model: First Annual Report. Princeton, NJ: Mathematica Inc.; December 2022. https://innovation.cms.gov/data-and-reports/2022/pcf-first-eval-rpt.
- Fu N, Singh P, Dale S, et al. Long-term effects of the Comprehensive Primary Care Model on health care spending and utilization. J Gen Intern Med. 2021;37:1713–1721. Published July 8, 2021. https://doi.org/10.1007/s11606-021-06952-w.
- Peikes D, Anglin G, Dale S, et al. Evaluation of the Comprehensive Primary Care Initiative: Fourth Annual Report. Princeton, NJ: Mathematica Policy Research; May 2018. https://downloads.cms.gov/files/cmmi/CPC-initiative-fourth-annual-report.pdf.
- U.S. Department of Health and Human Services, Centers for Medicare & Medicaid Services (CMS) Innovation Center. Comprehensive Primary Care Plus. Published Aug. 5, 2022. https://innovation.cms.gov/innovation-models/comprehensive-primary-care-plus.
- Rotter J, Calkins K, Stewart K, et al. Evaluation of the Maryland Total Cost of Care Model: Quantitative-Only Report for the Model’s First Three Years (2019 to 2021). Princeton, NJ: Mathematica; December 2022. https://innovation.cms.gov/data-and-reports/2022/md-tcoc-qor2.
- U.S. Department of Health and Human Services, Centers for Medicare & Medicaid Services (CMS). Maryland Total Cost of Care Model. Dec. 20, 2022. https://innovation.cms.gov/innovation-models/md-tccm.
- U.S. Department of Health and Human Services, Centers for Medicare & Medicaid Services (CMS). Maryland All-Payer Model: final evaluation report (2014-2018). https://innovation.cms.gov/files/reports/md-allpayer-finalevalrpt-fg.pdf. Accessed Dec. 12, 2022.
- Haber S, Beil H, Morrison M, et al. Evaluation of the Maryland All-Payer Model. Volume 1: Final Report. Waltham, MA: RTI International; November 2019. https://downloads.cms.gov/files/md-allpayer-finalevalrpt.pdf.
- U.S. Department of Health and Human Services, Centers for Medicare & Medicaid Services (CMS). Innovation Center Strategy Refresh. https://innovation.cms.gov/strategic-direction-whitepaper. Accessed Dec. 12, 2022.
- Fowler L, Rawal P, Fogler S, Walderson B, O’Connell M, Quinton J. The CMS Innovation Center’s strategy to support person-centered, value-based specialty care. CMS.gov [blog]. Nov. 7, 2022. https://www.cms.gov/blog/cms-innovation-centers-strategy-support-person-centered-value-based-specialty-care. Accessed Dec. 12, 2022.
- The Lewin Group. CMS Comprehensive Care for Joint Replacement (CJR) Model: Performance Year 4 Evaluation Report. Falls Church, VA: The Lewin Group; 2021. https://innovation.cms.gov/data-and-reports/2021/cjr-py4-annual-report. Accessed Dec. 12, 2022.
- U.S. Department of Health and Human Services, Centers for Medicare & Medicaid Services (CMS). Comprehensive Care for Joint Replacement (CJR) Model evaluation of performance years 1 to 4 (2016-2019). https://innovation.cms.gov/data-and-reports/2021/cjr-py4-ar-findings-aag. Accessed Dec. 12, 2022.
- U.S. Department of Health and Human Services, Centers for Medicare & Medicaid Services (CMS). Comprehensive Care for Joint Replacement Model. https://innovation.cms.gov/innovation-models/cjr. Accessed Dec. 20, 2022.
- U.S. Department of Health and Human Services, Centers for Medicare & Medicaid Services (CMS), Center for Medicare and Medicaid Innovation. Findings at a Glance: Bundled Payments for Care Improvement (BPCI) Initiative, Models 2-4, final evaluation: October 2013 through September 2018. https://innovation.cms.gov/data-and-reports/2021/bpci-models2-4-yr7evalrpt-fg. Accessed Dec. 12, 2022.
- Marrufo G, Bradley A, Somers J, et al. CMS Bundled Payments for Care Improvement Initiative Models 2-4: Year 7 Evaluation & Monitoring Annual Report. Falls Church, VA: The Lewin Group; March 2021. https://innovation.cms.gov/data-and-reports/2021/bpci-models2-4-yr7evalrpt.
- Somers J, Bradley A, Bacon K, et al. CMS Bundled Payments for Care Improvement Advanced Model: Third Evaluation Report. Falls Church, VA: The Lewin Group; February 2022. https://innovation.cms.gov/data-and-reports/2022/bpci-adv-ar3.
- U.S. Department of Health and Human Services, Centers for Medicare & Medicaid Services (CMS). Findings at a Glance: Bundled Payments for Care Improvement Advanced (BPCI Advanced) Model, model years 1 & 2 (October 2018 through December 2019). https://innovation.cms.gov/data-and-reports/2022/bpci-adv-ar3-findings-aag. Accessed Nov. 16, 2022.
- U.S. Department of Health and Human Services, Centers for Medicare & Medicaid Services (CMS). BPCI Advanced: Quality Measures. Oct. 26, 2022. https://innovation.cms.gov/innovation-models/bpci-advanced/quality-measures-fact-sheets. Accessed Nov. 4, 2022.
- Hassol A, West N, Simon C, et al. Evaluation of the Oncology Care Model: Performance Periods 1-6, OCM Impacts on Payments. Rockville, MD: Abt Associates; December 2021. https://innovation.cms.gov/data-and-reports/2021/ocm-ar4-eval-payment-impacts.
- U.S. Department of Health and Human Services, Centers for Medicare & Medicaid Services (CMS). Findings at a Glance. Oncology Care Model (OCM), Evaluation of Performance Periods 1 to 6. https://innovation.cms.gov/data-and-reports/2021/ocm-ar4-eval-part-persp-aag. Accessed Dec. 19, 2022.
- U.S. Department of Health and Human Services, Centers for Medicare & Medicaid Services (CMS). Enhancing Oncology Model. Dec. 19, 2022. https://innovation.cms.gov/innovation-models/enhancing-oncology-model.
- Chopra Z, Gulseren B, Chhabra KR, Dimick JB, Ryan AM. Bundled Payments for Care Improvement efficacy across 3 common operations. Ann Surg. 2023;277(1):e16-e23. https://doi.org/10.1097/SLA.0000000000004869.
- Joynt Maddox KE, Orav EJ, Zheng J, Epstein AM. Learning and the “early joiner” effect for medical conditions in Medicare’s Bundled Payments for Care Improvement Program: retrospective cohort study. Med. Care. 2020;58(10):895-902. https://doi.org/10.1097/MLR.0000000000001395.
- Rolnick JA, Liao JM, Emanuel EJ, et al. Spending and quality after three years of Medicare’s bundled payments for medical conditions: quasi-experimental difference-in-differences study. BMJ 2020;369:m1780. https://www.bmj.com/content/bmj/369/bmj.m1780.full.pdf.
- Joynt Maddox KE, Orav EJ, Zheng J, Epstein AM. Year 1 of the Bundled Payments for Care Improvement-Advanced Model. N Engl J Med. 2021;385(7):618-627. https://doi.org/10.1056/NEJMsa2033678.
- AAMC. Council of Teaching Hospitals Annual Survey of Hospital Operations and Financial Performance (OpFin) Annual Report, Fiscal Year, FY 2021. Washington, DC: AAMC; October 2022. https://www.aamc.org/data-reports/teaching-hospitals/report/opfin-report.
- National Quality Forum. Developing and Testing Risk Adjustment Models for Social and Functional Status-Related Risk Within Healthcare Performance Measurement: Final Technical Guidance, Phase 2. Washington, DC: National Quality Forum; Dec. 21, 2022. https://www.qualityforum.org/Publications/2022/12/NQF: Risk_ Adjustment_ Technical_ Guidance_ Final_ Report_-_ - Phase_ 2.aspx (qualityforum.org).
- Health Care Payment Learning & Action Network. Advancing Health Equity through APMs: Guidance for Equity-Centered Designed and Implementation. 2021. http://hcp-lan.org/workproducts/APM-Guidance/Advancing-Health-Equity-Through-APMs.pdf.
- National Quality Forum. NQF issues quality roadmap for reducing healthcare disparities. https://www.qualityforum.org/NQFs_Roadmap_to_Health_Equity.aspx.
- Dube J. Finding value in health equity: addressing social needs through value based care. Talk presented at: AAMC Learn Serve Lead 2022; Nov. 12, 2022; Nashville, TN.
- Hughes, D. Finding value in health equity: addressing social needs through value based care. Talk presented at: AAMC Learn Serve Lead 2022; Nov. 12, 2022; Nashville, TN.
- McCullough JM, Coult N, Genau M, Raikhelkar A, Love K, Riley W. Safety net representation in federal payment and care delivery reform initiatives. Am J Accountable Care. 2019; 7;(1). https://www.ajmc.com/view/safety-net-representation-in-federal-payment-and-care-delivery-reform-initiatives.
- American Hospital Association. Rural Hospital Closures Threaten Access: Solutions to Preserve Care in Local Communities. Chicago, IL, and Washington, DC: American Hospital Association; September 2022. https://www.aha.org/2022-09-07-rural-hospital-closures-threaten-access.
- Trombley MJ, McWilliams J M, Fout B, Morefield B. ACO Investment Model produced savings, but the majority of participants exited when faced with downside risk. Health Affairs. 2022;41(1):138-146. https://doi.org/10.1377/hlthaff.2020.01819.
- Lin SC, Joynt Maddox KE, Ryan AM, Moloci N, Shay A, Hollingsworth JM. Exit rates of accountable care organizations that serve high proportions of beneficiaries of racial and ethnic minority groups. JAMA Health Forum. 2022;3(9):e223398. https://doi.org/10.1001/jamahealthforum.2022.3398.
- Carlo AD, Benson NM, Chu F, Busch AB. Association of alternative payment and delivery models with outcomes for mental health and substance use disorders: a systematic review. JAMA Netw Open. 2020;3(7):e207401. https://doi.org/10.1001/jamanetworkopen.2020.7401.
- Brown K, El Husseini N, Grimley et al. Alternative payment models and associations with stroke outcomes, spending, and service utilization: a systematic review. Stroke. 2021;53(1):268-278. doi:10.1161/strokeaha.121.033983.