Medicare is the single largest payer of health care services in the United States, totaling $900.8 billion in 2021.1 While Medicare remains a critical source of clinical revenues, new research from the AAMC Research and Action Institute shows not-for-profit hospitals and teaching hospitals lose money on a majority of the inpatient fee-for-service diagnosis-related groups they provide to Medicare beneficiaries, underscoring the importance of other sources of revenue. Previous findings show that not-for-profit teaching hospitals provide the widest variety of clinical services, including those that are thought to negatively affect hospital margins. These hospitals also lose money on Medicare admissions when cases are considered in total.2
Using data from the 2021 Healthcare Cost and Utilization Project’s National Inpatient Sample (HCUP NIS), Medicare Standard Analytic File (SAF) inpatient discharges (claims), and the American Hospital Association’s Annual Survey Database, the Research and Action Institute found that, when examined at the Medicare Severity Diagnosis-Related Group Version 33 (MS-DRG) level, nearly all services provided to Medicare beneficiaries lost money in 2021. By comparison, for-profit hospitals were more likely to have higher charges per discharge, shorter inpatient hospital lengths of stay, and lower complexity cases as measured by case mix than not-for-profit and teaching hospitals. This data snapshot highlights the discrepancies in the costs, charges, and payments for specific MS-DRGs in the United States to find total gains and losses of specific services offered through Medicare across six types of acute, general hospitals.
To calculate the government’s estimate of profitability of hospital services, the average costs and payments of discharges were examined by MS-DRG using the HCUP NIS data for costs and Medicare SAF discharge claim for payments.
In 2021, hospitals saw an aggregate loss of $4.9 billion, or an average loss of $2,244 per discharge. Of the 737 MS-DRGs examined across Medicare inpatient fee-for-service discharges and all categories of hospitals, only 29 (3.9%) were profitable in 2021. In a 2022 AAMC publication, the authors noted that U.S. hospitals, on average, have negative Medicare operating margins but a positive all-payer operating margin, suggesting that they offset Medicare losses with higher reimbursements from private insurance. In fiscal year (FY) 2021, AAMC-member teaching hospitals’ Medicare margins were -17.5%, compared with -10.2% for nonteaching hospitals. All-payer operating margins were 5.9% for AAMC-member hospitals, compared with 7.4% for nonteaching hospitals.3
Not-for-profit and teaching hospitals provide the broadest range of services when examined by service line and treat the widest variety of MS-DRGs compared to for-profit and nonteaching hospitals. Of the 115 MS-DRGs offered only in not-for-profit and teaching hospitals, the majority were unprofitable. In addition, a larger share of the MS-DRGs reimbursed by Medicare were profitable in for-profit hospitals than in not-for-profit hospitals (24.3% and 3.8%, respectively).
By volume, profitable Medicare MS-DRGs made up one in five fee-for-service Medicare claims in for-profit hospitals (20.0%) but only one in 20 claims in not-for-profit hospitals (5.8%) (Table 1).
| Total Number of MS-DRGs Offered | Number of Profitable MS-DRGs | Share of MS-DRGs That Are Profitable | Share of Total Claims With Profitable MS-DRGs | |
|---|---|---|---|---|
| All hospitals | 737 | 29 | 3.9% | 5.7% |
| Not-for-profit | 737 | 28 | 3.8% | 5.8% |
| For-profit | 622 | 151 | 24.3% | 20.0% |
| Teaching | 737 | 41 | 5.6% | 5.8% |
| Nonteaching | 651 | 33 | 5.1% | 6.3% |
| Not-for-profit teaching | 737 | 39 | 5.3% | 5.9% |
For-profit hospitals had the lowest average cost-to-charge ratios (CCR) across MS-DRGs. Costs are the expenses incurred for hospital discharges and charges are the amount hospitals bill for those discharges.4 For-profit hospitals also had larger payment-to-cost ratios (PTCR) than not-for-profit hospitals, meaning for-profit hospitals received larger payments for each cost than not-for-profit hospitals (Figure 1). On average, not-for-profit hospitals lost more than four times as much money as for-profit hospitals per discharge (-$2,553 and -$572, respectively). For-profit teaching hospitals were the only hospital type to see gains ($124 per discharge). Teaching hospitals may receive additional support from Medicare via indirect medical education (IME) payments, outlier payments, and disproportionate share (DSH) payments, which may explain some of the differences seen across hospital types. Without these additional payments, the losses from Medicare payments would be even higher.
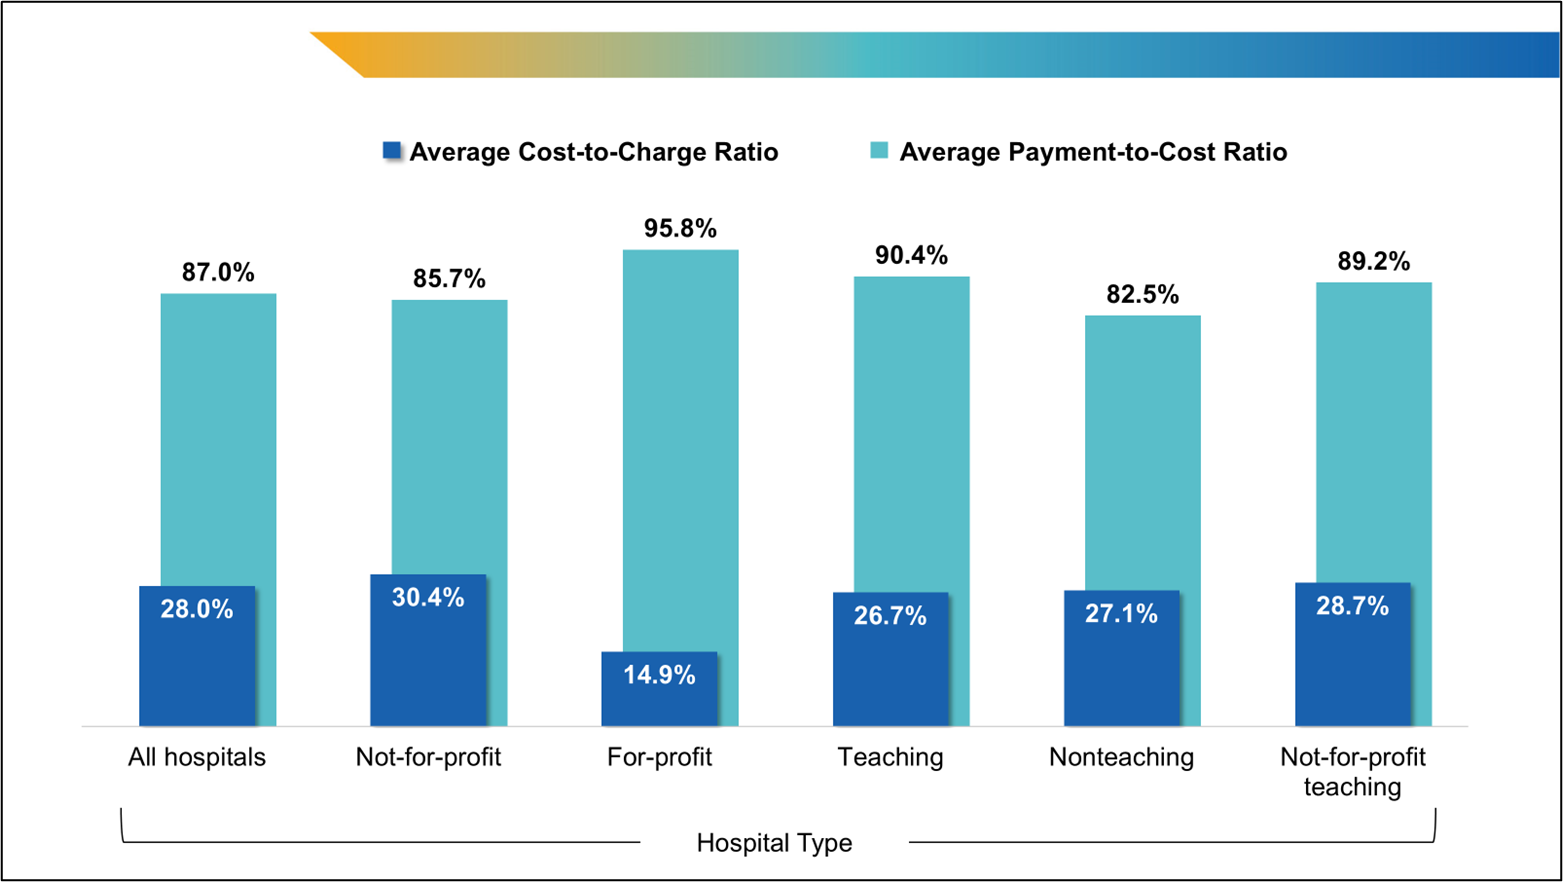
Figure 1. Average Medicare Cost-to-Charge Ratio and Payment-to-Cost Ratio by Hospital Type
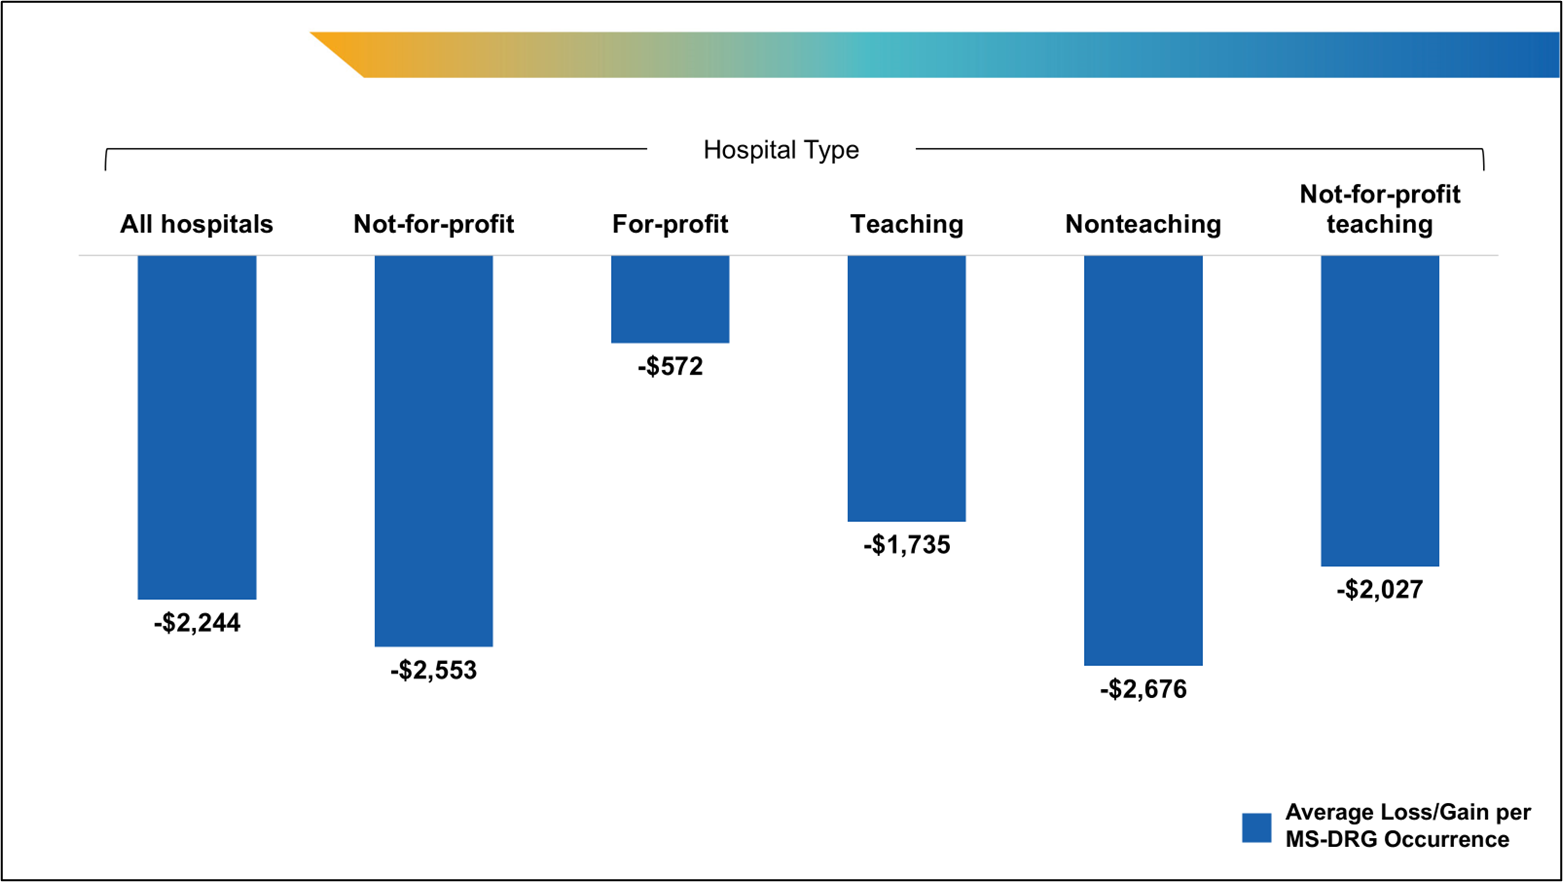
Figure 2. Average Medicare Loss Per Inpatient Fee-for-Service Discharge
Across hospital types, 25.1% of MS-DRGs treated fell into the highest case-mix index5 (CMI) quartile in 2021. Teaching, not-for-profit, and not-for-profit teaching hospitals had larger shares of discharges with the greatest complexity compared with other hospital types. Of the most complex MS-DRGs relative to total discharges, 15.8% of discharges at teaching hospitals were for said MS-DRGs, 14.2% at not-for-profit hospitals, and 15.9% at not-for-profit teaching hospitals. For-profit and nonteaching hospitals had the lowest shares of discharges with the most complex MS-DRGs (13.2% and 10.9%, respectively). As a total share of the most complex discharges, teaching (80.6%) and not-for-profit (85.9%) hospitals accounted for the greatest shares, while for-profit only had 14.1% of the most complex cases and nonteaching hospitals had 19.4%. In addition, not-for-profit hospitals treating the most complex MS-DRGs lost money on these cases (an average of -$5,894 per discharge) whereas for-profit hospitals saw gains (an average of $218 per discharge). Across all hospital types, not-for-profit nonteaching hospitals lost the most on average treating the most complex MS-DRGs (-$5,943 per discharge).
There are limitations in these measurements, including MS-DRGs, CMI, and other charges that may be contributing to the higher losses seen in not-for-profit and teaching hospitals, as compared with for-profit hospitals. There also are limitations in using MS-DRGs as a patient classification scheme given that inpatient claims provide only basic patient characteristics that are routinely collected in a hospital’s record system (e.g., age, sex).6
Past analyses have also found differences in patient complexity by hospital and membership type; AAMC-member teaching hospitals treat higher rates of outlier cases (4.4%) as compared with other teaching (1.9%) and nonteaching (1.6%) hospitals.7
Not-for-profit hospitals and teaching hospitals often treat patients with more complex social needs and are also associated with greater health-related social needs screening as compared to other hospital types.8 A study looking at the time patients spent waiting for discharge found that at 15 academic hospitals, almost 10% of patients had major discharge barriers, resulting in them spending a month or longer medically ready for discharge but without the skilled therapy or support services available.9 The impact of health-related social needs on cost warrants further study.
All hospital types lose money on Medicare fee-for-service inpatient discharges. Notably, hospitals lose money on almost all individual Medicare fee-for-service MS-DRGs, even with additional targeted payments meant to account for the higher costs of highly specialized services, research, and teaching. Hospitals cannot negotiate with government payers, meaning hospitals must achieve a positive margin through services paid for by other payers, philanthropy, and investments.
Methods
Analyses were conducted using R and utilized data from the Agency for Healthcare Research and Quality (Healthcare Cost & Utilization Project [HCUP]), American Hospital Association (AHA) (Annual Survey Database [ASDB], Fiscal Year [FY] 2021), and the Centers for Medicare & Medicaid Services (CMS) inpatient 100% Medicare fee-for-service claims (LDS Standard Analytic Files [SAF], 2021).
Patients who died, left against medical advice, had a childbirth, were under the age of 18 years, were not enrolled in Medicare (traditional or managed care), and whose total cost was zero or missing were excluded from the analyses. In addition, all discharges in which the provider identifier was missing, or the claim payment amount was zero or missing, were also excluded. Hospital teaching status and ownership were gathered using ASDB and merged by Medicare provider number with the SAF data. Only short-term general hospitals were included in the analyses, excluding federal, state and local government, Veteran’s Affairs, children’s, and specialty hospitals. Table 5 of CMS’s FY 2021 IPPS Final Rule and Correction Notice was used to determine MS-DRG-level weights for case mix index (CMI). At the MS-DRG level, all claims with a missing MS-DRG or MS-DRG “999” and counts fewer than 11 were excluded from the analyses.
Each HCUP inpatient claim’s payment was manually estimated as the average payment for its MS-DRG and hospital types in the Medicare SAF inpatient claims data. Each HCUP inpatient claim cost was estimated as the total charges deflated by the hospital’s cost-to-charge ratio. Costs and payment were aggregated to the MS-DRG and hospital type, and averaged by dividing by the HCUP and SAF claims counts, respectively.
Using MS-DRGs as the tool for measuring services, payments, and costs may provide limited insight into the care provided to patients but does provide insight on the trends and where treatment was received by hospital characteristics. In addition, these analyses utilized only Medicare fee-for-service data and are not fully representative of the entire health care system.
Note: The AAMC Research and Action Institute closed on June 30, 2025. Read more about the Institute’s work.
- Centers for Medicare and Medicaid Services. National Health Spending Grew Slightly in 2021. Office of the Actuary. Published December 14, 2022. Accessed June 2, 2025. https://www.cms.gov/newsroom/press-releases/national-health-spending-grew-slightly-2021 Back to text ↑
- Medicare Payment Advisory Commission. Report to the Congress: Medicare Payment Policy. Published March 2025. Accessed June 2 2025. https://www.medpac.gov/wp-content/uploads/2025/03/Mar25_MedPAC_Report_To_Congress_SEC.pdf. Back to text ↑
- AAMC analysis of FY2021 the Hospital Cost Reporting Information System (HCRIS) released on July 30, 2023. AAMC membership data, September 2023. Back to text ↑
- Agency for Healthcare Research and Quality. Cost to Charge Ratio for Inpatient Files. Healthcare Cost and Utilization Project. Updated April 17, 2025. Accessed May 16, 2025. https://hcup-us.ahrq.gov/db/ccr/ip-ccr/ip-ccr.jsp Back to text ↑
- CMIs are at the MS-DRG level and a hospital’s CMI represents the average DRG weight divided by the number of discharges. CMI provides a numeric value depicting the hospital’s complexity of patients treated at the facility. Back to text ↑
- Centers for Medicare and Medicaid Services. Design and Development of the Diagnosis Related Group (DRG). Updated April 2024. Accessed April 8, 2025. https://www.cms.gov/icd10m/FY2025-NPRM-Version42-fullcode-cms/fullcode_cms/Design_and_development_of_the_Diagnosis_Related_Group_(DRGs).pdf Back to text ↑
- AAMC analysis of MedPAR Medicare fee-for-service claims data from FY2016-FY2023. Available at https://www.aamc.org/media/10266/download. Back to text ↑
- Ashe JJ, Baker MC, Alvarado CS, Alberti PM. Screening for health-related social needs and collaboration with external partners among US hospitals. JAMA Netw Open. 2023;6(8):e2330228. doi:10.1001/jamanetworkopen.2023.30228. Back to text ↑
- Bann M, Meo N, Lopez JP, et al. Medically ready for discharge: A multisite "point-in-time" assessment of hospitalized patients. J Hosp Med. 2023 Sep;18(9):795-802. doi: 10.1002/jhm.13184. Epub 2023 Aug 8. PMID: 37553979. Back to text ↑