National Data on Medical Student Success Outcomes
This page features national data on medical student outcomes from the most recent cohorts available. The grids below describe how well undergraduate GPAs and MCAT scores predict medical student performance on the Step 1 exam (first attempt and ever), the Step 2 CK exam (first attempt and ever), on-time progression to year three, progression to year three with an extra year, and graduation from medical school within four or five years. The first set of grids use total GPA and total MCAT score. The second set of grids use BCPM (science) GPA and total MCAT score. All MCAT scores are from the current version of the MCAT exam. Examining the associations of undergraduate GPAs and MCAT scores with these varied outcomes provides different insights about the likelihood of success for applicants with different ranges of undergraduate GPAs and MCAT scores.
Total GPA/Total MCAT Score Grids by Student Success Outcomes
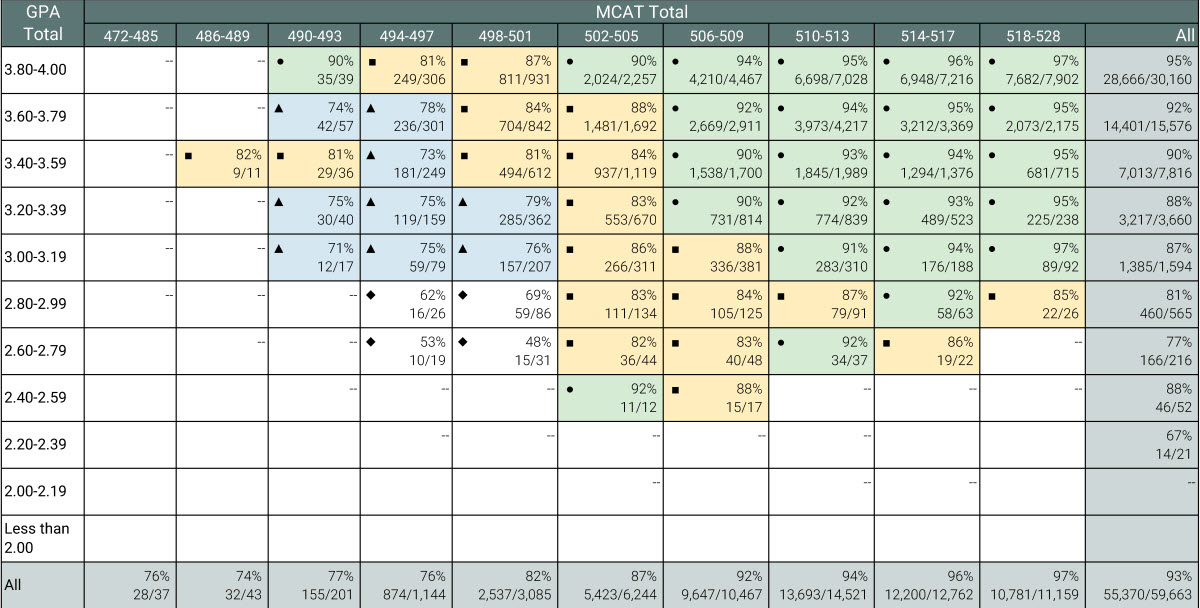
Passing Step 1 on the First Attempt: 2021, 2022, and 2023 Matriculants
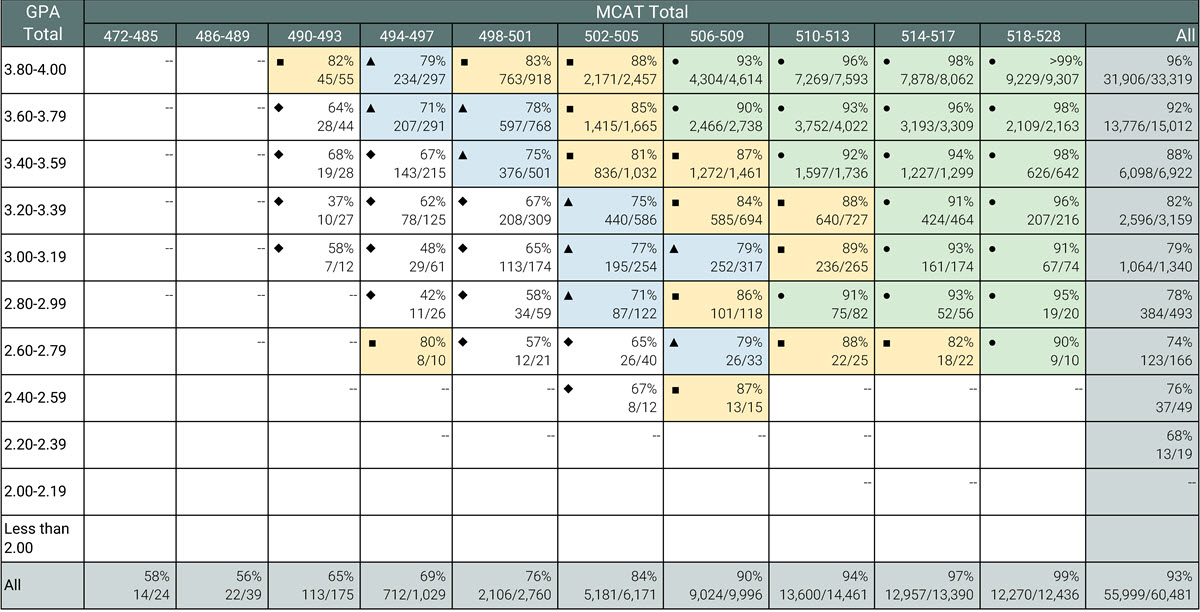
Note: Note: Green (●) = pass rates of 90%–100%; yellow (■) = pass rates of 80%–89%; blue (▲) = pass rates of 70%–79%; white (♦) = pass rates of 69% and lower. Cells with dashes = fewer than 10 observations; blank cells = zero observations. For students who took the MCAT exam multiple times, the most recent MCAT total score was used in this analysis. See https://www.usmle.org/early-release-usmle-step-1-2022-summary-performance for more information.
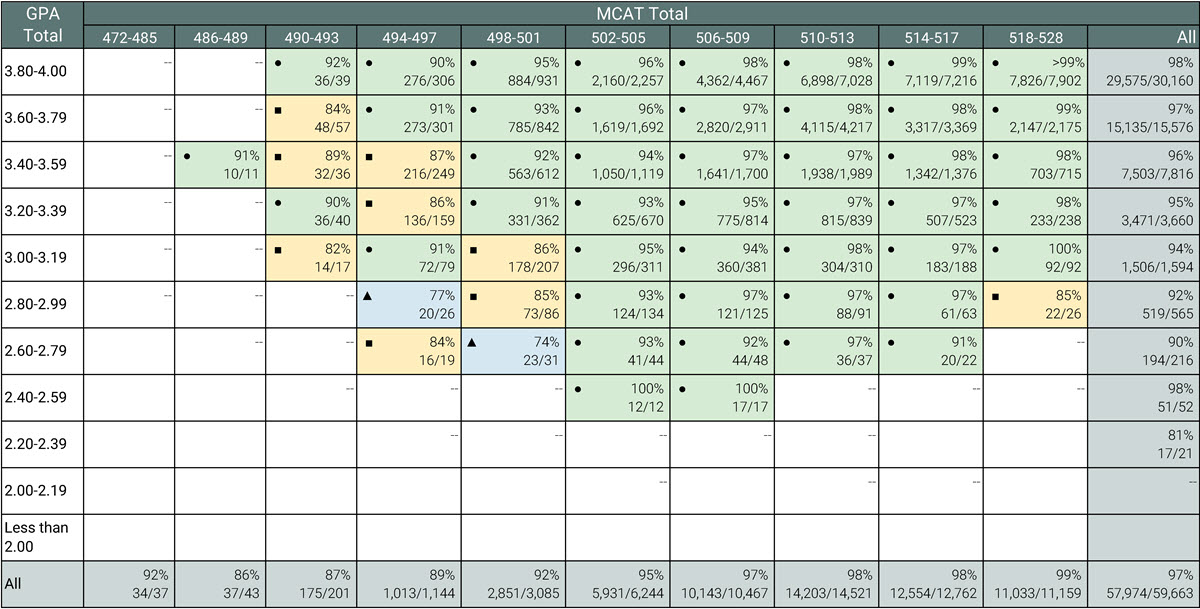
Passing Step 1 Ever: 2021, 2022, and 2023 Matriculants
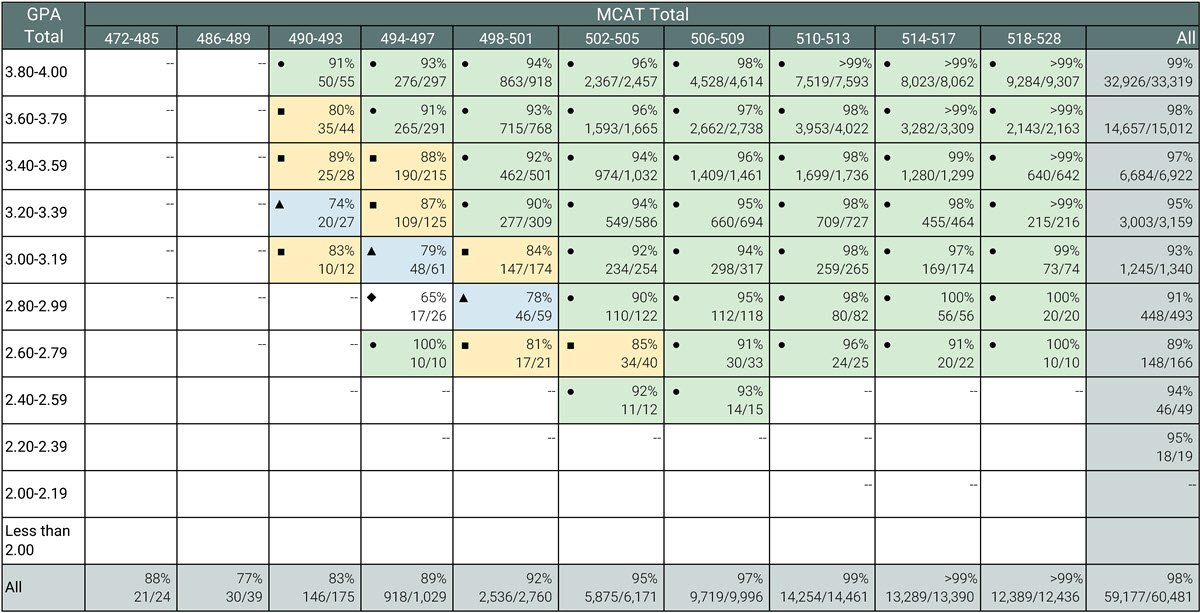
Note: Green (●) = pass rates of 90%–100%; yellow (■) = pass rates of 80%–89%; blue (▲) = pass rates of 70%–79%; white (♦) = pass rates of 69% and lower. Cells with dashes = fewer than 10 observations; blank cells = zero observations. For students who took the MCAT exam multiple times, the most recent MCAT total score was used in this analysis. See https://www.usmle.org/early-release-usmle-step-1-2022-summary-performance for more information.
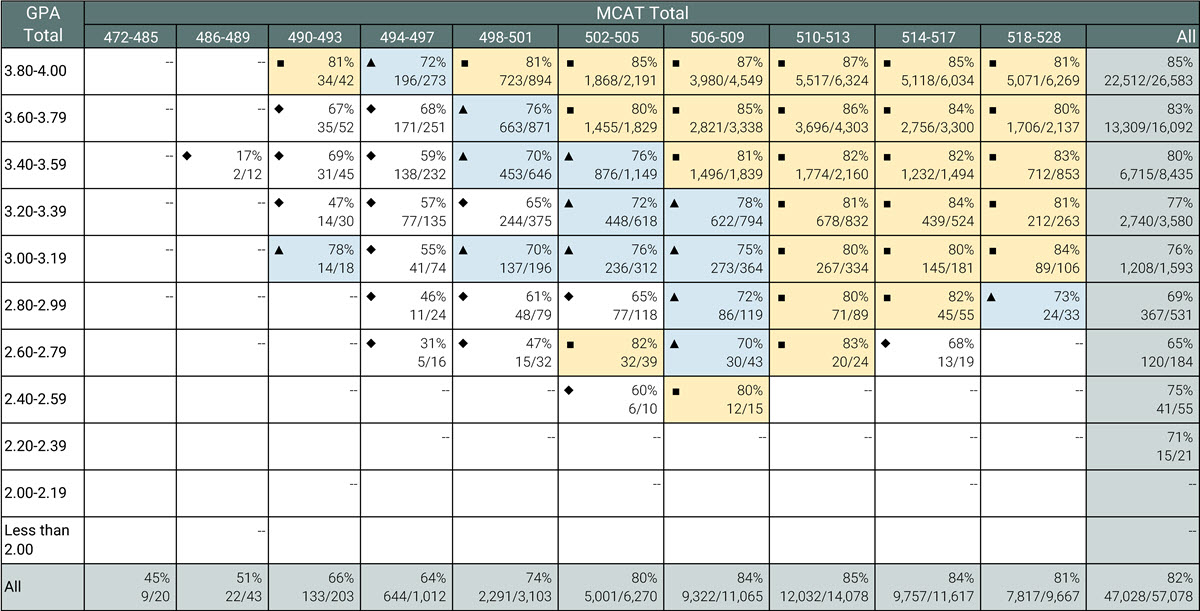
Passing Step 2 CK on the First Attempt: 2020, 2021, and 2022 Matriculants
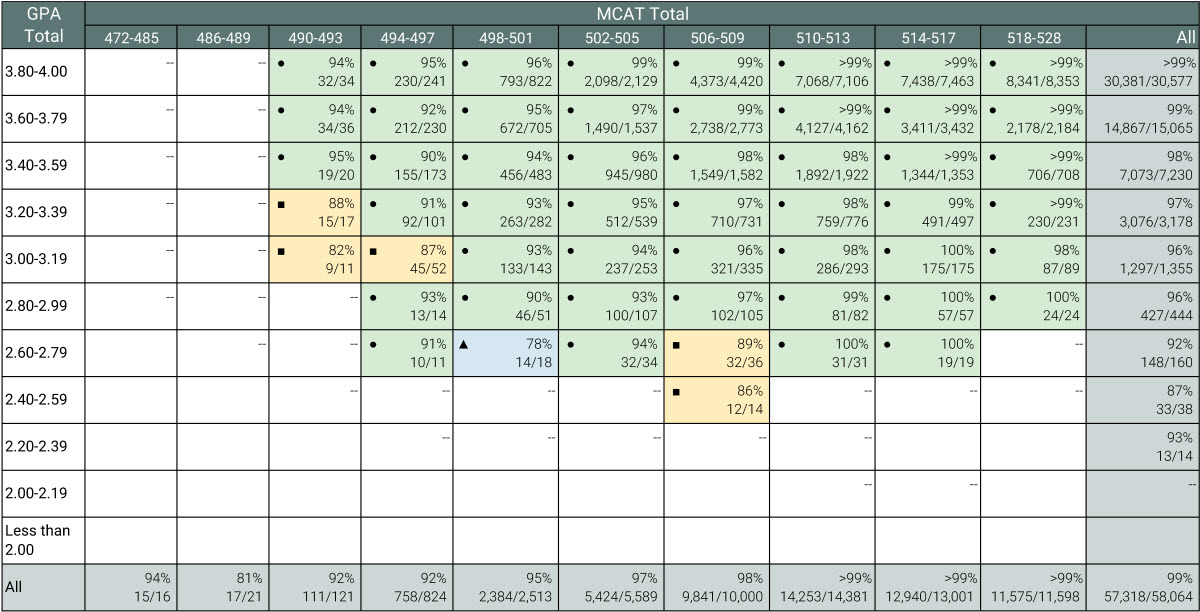
Note: Green (●) = pass rates of 90%–100%; yellow (■) = pass rates of 80%–89%; blue (▲) = pass rates of 70%–79%; white (♦) = pass rates of 69% and lower. Cells with dashes = fewer than 10 observations; blank cells = zero observations. For students who took the MCAT exam multiple times, the most recent MCAT total score was used in this analysis.
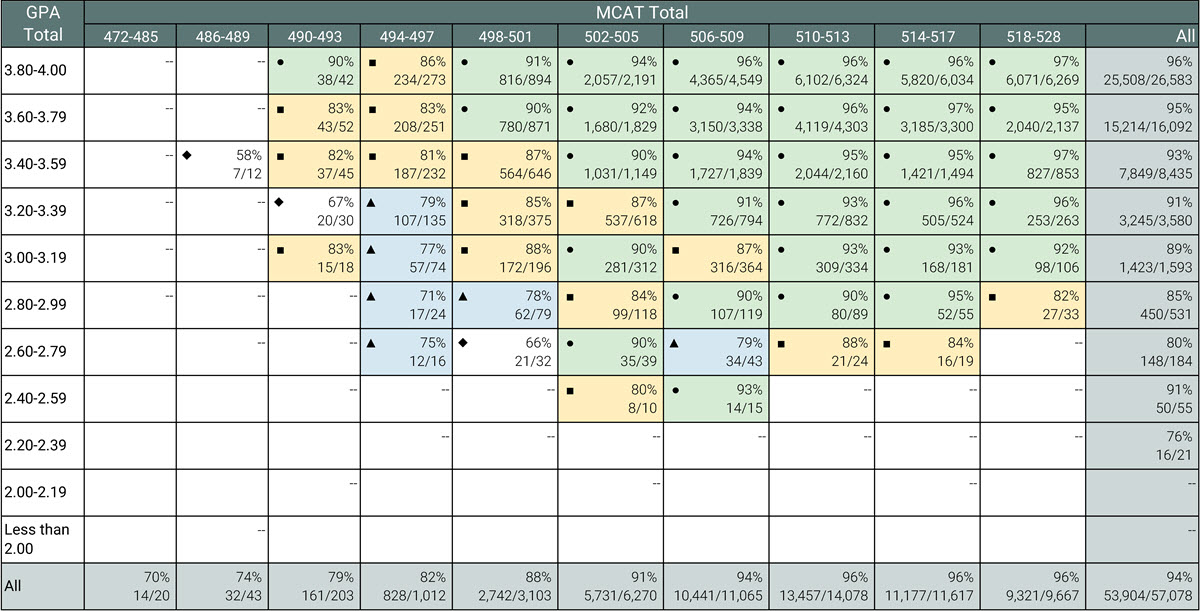
Passing Step 2 CK Ever: 2020, 2021, and 2022 Matriculants
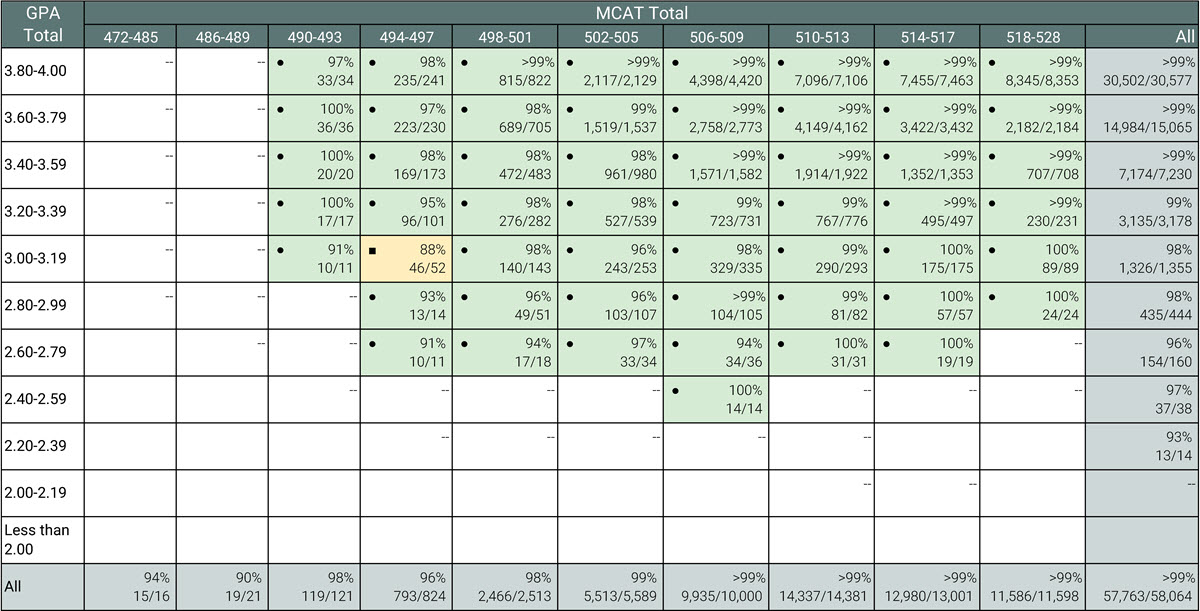
Note: Green (●) = pass rates of 90%–100%; yellow (■) = pass rates of 80%–89%; blue (▲) = pass rates of 70%–79%; white (♦) = pass rates of 69% and lower. Cells with dashes = fewer than 10 observations; blank cells = zero observations. For students who took the MCAT exam multiple times, the most recent MCAT total score was used in this analysis.
Progression to Year Three on Time: 2020, 2021, and 2022 Matriculants
Note: Green (●) = progression rates of 90%–100%; yellow (■) = progression rates of 80%–89%; blue (▲) = progression rates of 70%–79%; white (♦) = progression rates of 69% and lower. Cells with dashes = fewer than 10 observations; blank cells = zero observations. For students who took the MCAT exam multiple times, the most recent MCAT total score was used in this analysis. Students who entered medical school with advanced standing from medical, graduate, or other programs; were enrolled in joint programs (e.g., MD-PhD) at the time of matriculation or graduation; participated in special research/nonresearch studies; or are deceased are not included in this table.
Progression to Year Three With an Extra Year: 2020, 2021, and 2022 Matriculants
Note: Green (●) = progression rates of 90%–100%; yellow (■) = progression rates of 80%–89%; blue (▲) = progression rates of 70%–79%; white (♦) = progression rates of 69% and lower. Cells with dashes = fewer than 10 observations; blank cells = zero observations. For students who took the MCAT exam multiple times, the most recent MCAT total score was used in this analysis. Students who entered medical school with advanced standing from medical, graduate, or other programs; were enrolled in joint programs (e.g., MD-PhD) at the time of matriculation or graduation; participated in special research/nonresearch studies; or are deceased are not included in this table.
Graduation Within Four Years: 2018, 2019, and 2020 Matriculants
Note: Green (●) = graduation rates of 90%–100%; yellow (■) = graduation rates of 80%–89%; blue (▲) = graduation rates of 70%–79%; white (♦) = graduation rates of 69% and lower. Cells with dashes = fewer than 10 observations; blank cells = zero observations. For students who took the MCAT exam multiple times, the most recent MCAT total score was used in this analysis. Students who entered medical school with advanced standing from medical, graduate, or other programs; were enrolled in joint programs (e.g., MD-PhD) at the time of matriculation or graduation; participated in special research/nonresearch studies; or are deceased are not included in this table.
Graduation Within Five Years: 2018, 2019, and 2020 Matriculants
Note: Green (●) = graduation rates of 90%–100%; yellow (■) = graduation rates of 80%–89%; blue (▲) = graduation rates of 70%–79%; white (♦) = graduation rates of 69% and lower. Cells with dashes = fewer than 10 observations; blank cells = zero observations. For students who took the MCAT exam multiple times, the most recent MCAT total score was used in this analysis. Students who entered medical school with advanced standing from medical, graduate, or other programs; were enrolled in joint programs (e.g., MD-PhD) at the time of matriculation or graduation; participated in special research/nonresearch studies; or are deceased are not included in this table.
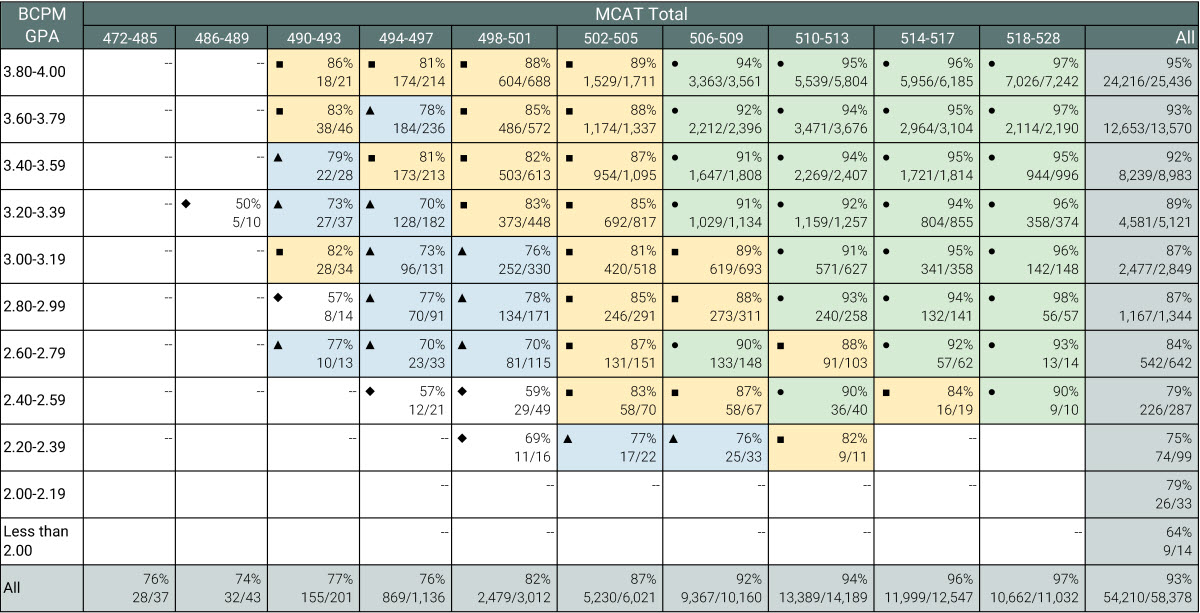
BCPM GPA/Total MCAT Score Grids by Student Success Outcomes
Passing Step 1 on the First Attempt: 2021, 2022, and 2023 Matriculants
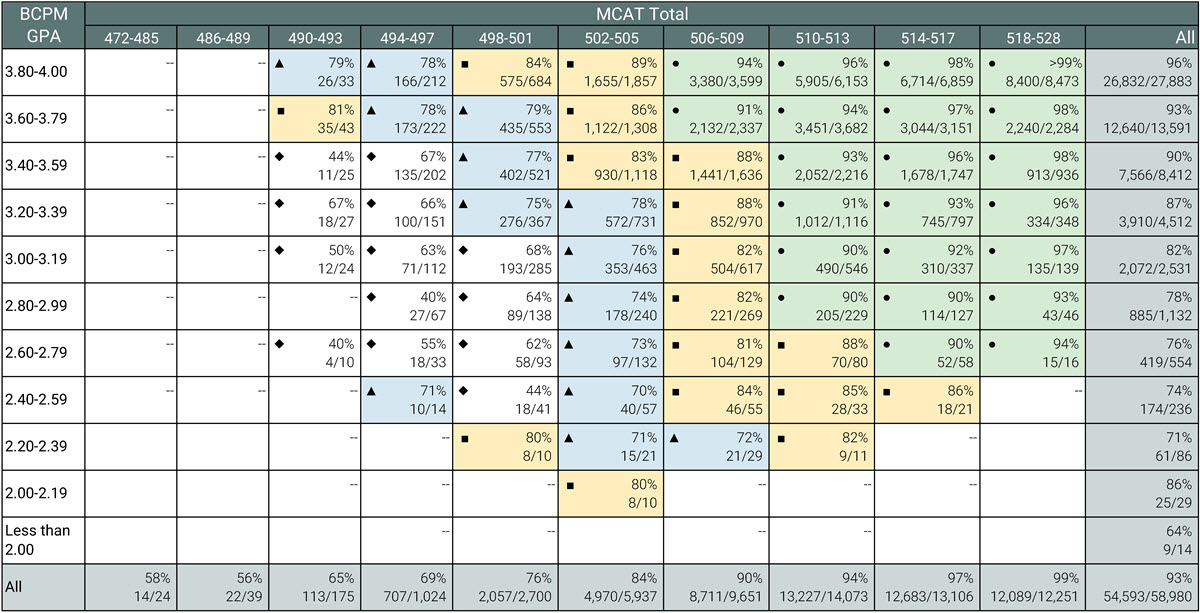
Note: Note: Green (●) = pass rates of 90%–100%; yellow (■) = pass rates of 80%–89%; blue (▲) = pass rates of 70%–79%; white (♦) = pass rates of 69% and lower. Cells with dashes = fewer than 10 observations; blank cells = zero observations. For students who took the MCAT exam multiple times, the most recent MCAT total score was used in this analysis. See https://www.usmle.org/early-release-usmle-step-1-2022-summary-performance for more information.
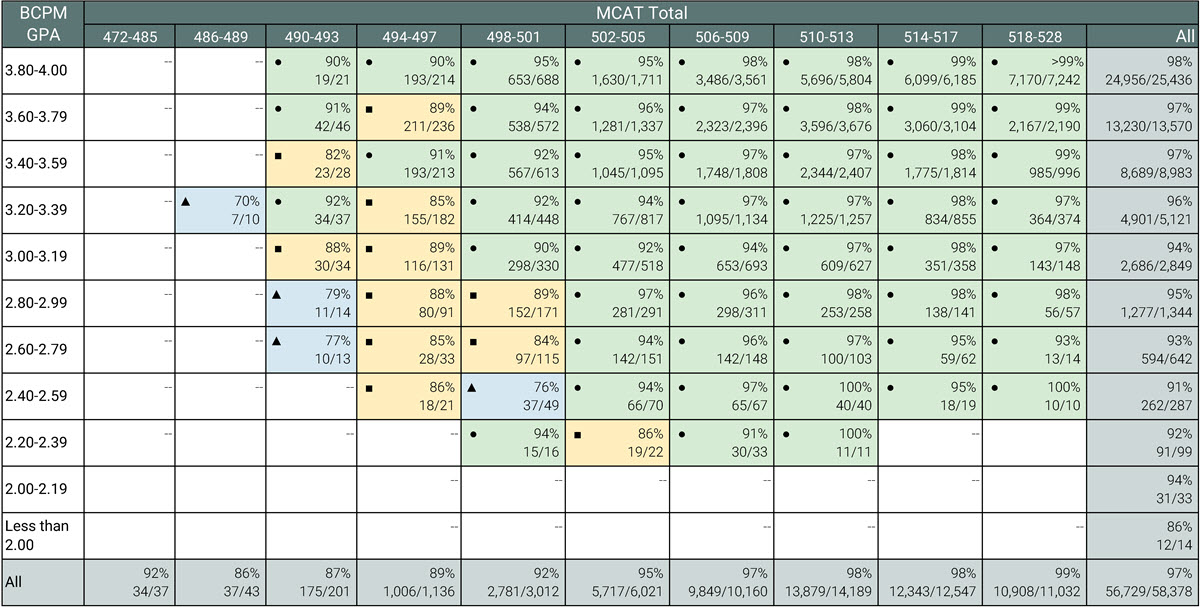
Passing Step 1 Ever: 2021, 2022, and 2023 Matriculants
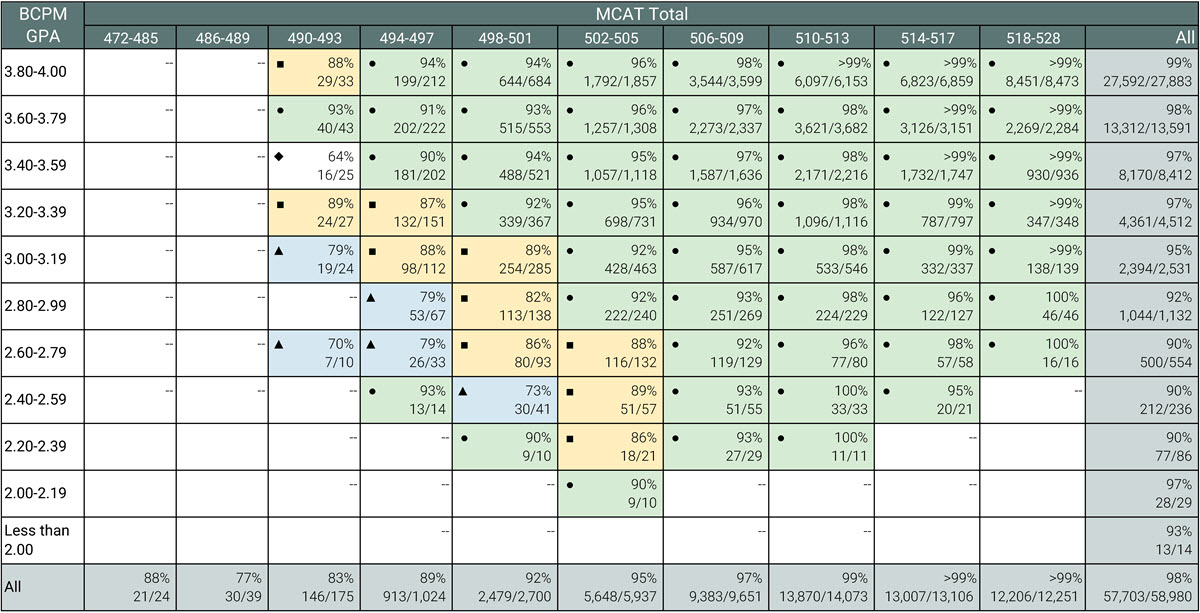
Note: Green (●) = pass rates of 90%–100%; yellow (■) = pass rates of 80%–89%; blue (▲) = pass rates of 70%–79%; white (♦) = pass rates of 69% and lower. Cells with dashes = fewer than 10 observations; blank cells = zero observations. For students who took the MCAT exam multiple times, the most recent MCAT total score was used in this analysis. See https://www.usmle.org/early-release-usmle-step-1-2022-summary-performance for more information.
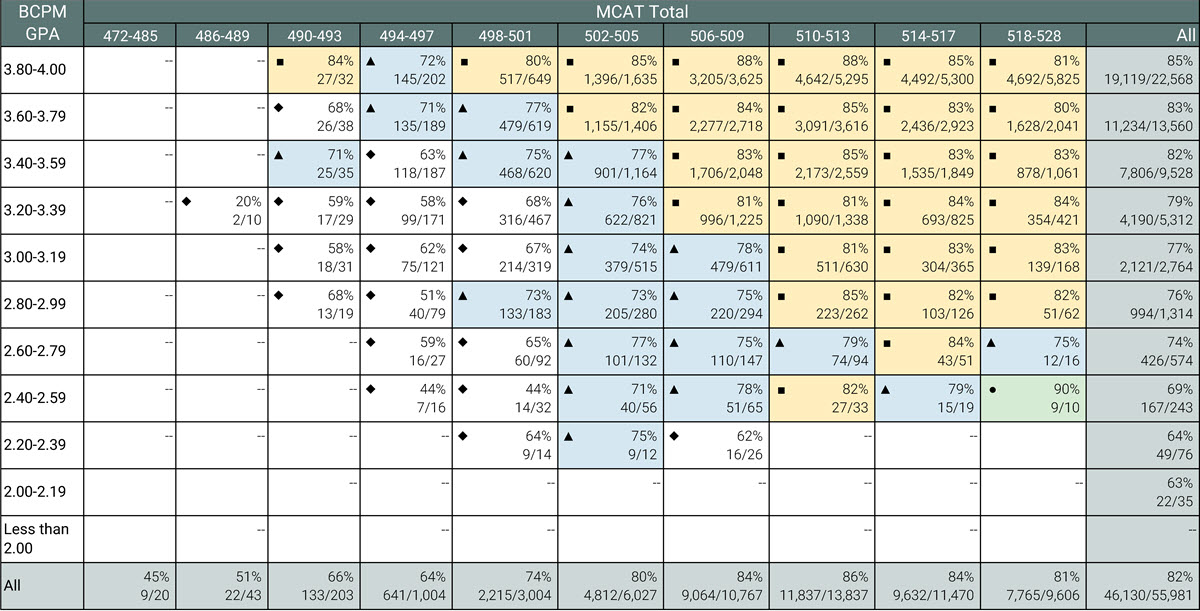
Passing Step 2 CK on the First Attempt: 2020, 2021, and 2022 Matriculants
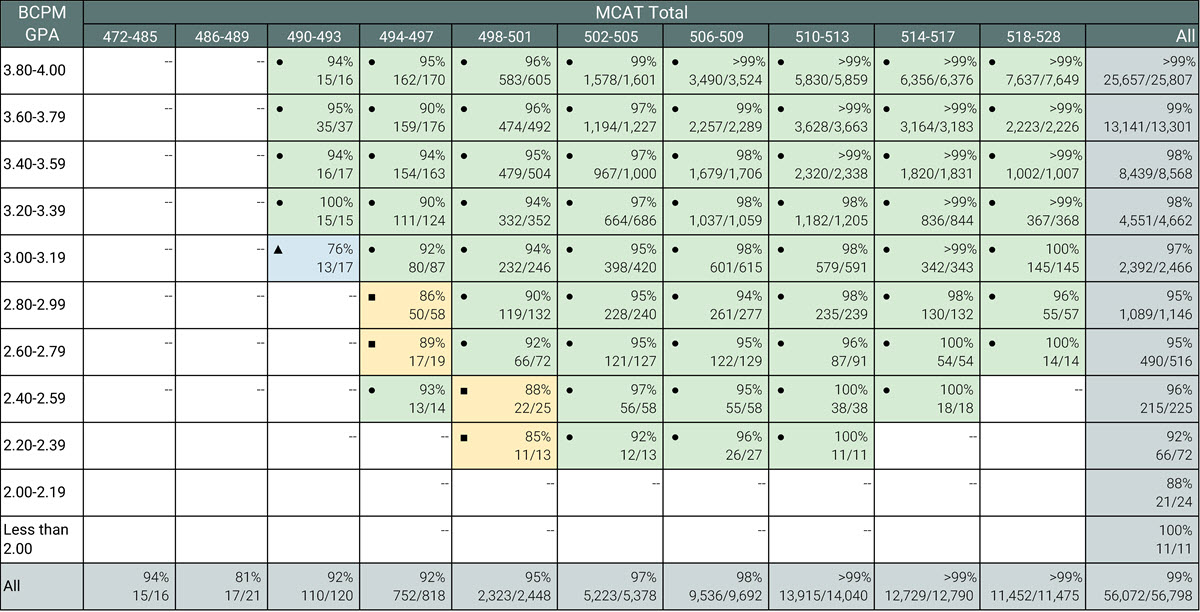
Note: Green (●) = pass rates of 90%–100%; yellow (■) = pass rates of 80%–89%; blue (▲) = pass rates of 70%–79%; white (♦) = pass rates of 69% and lower. Cells with dashes = fewer than 10 observations; blank cells = zero observations. For students who took the MCAT exam multiple times, the most recent MCAT total score was used in this analysis.
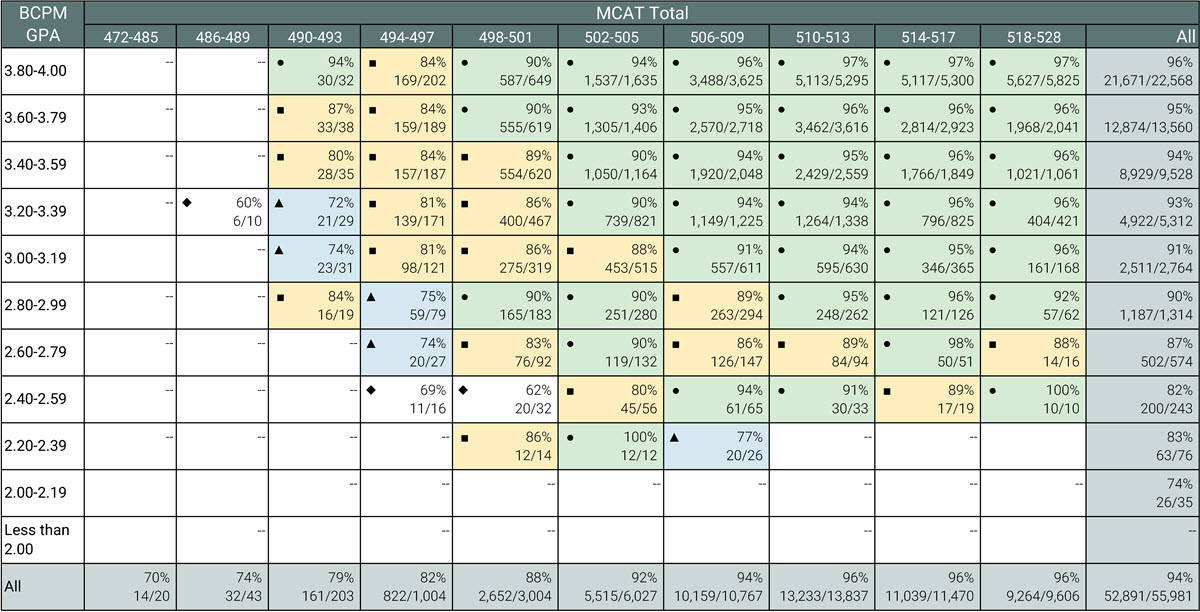
Passing Step 2 CK Ever: 2020, 2021, and 2022 Matriculants
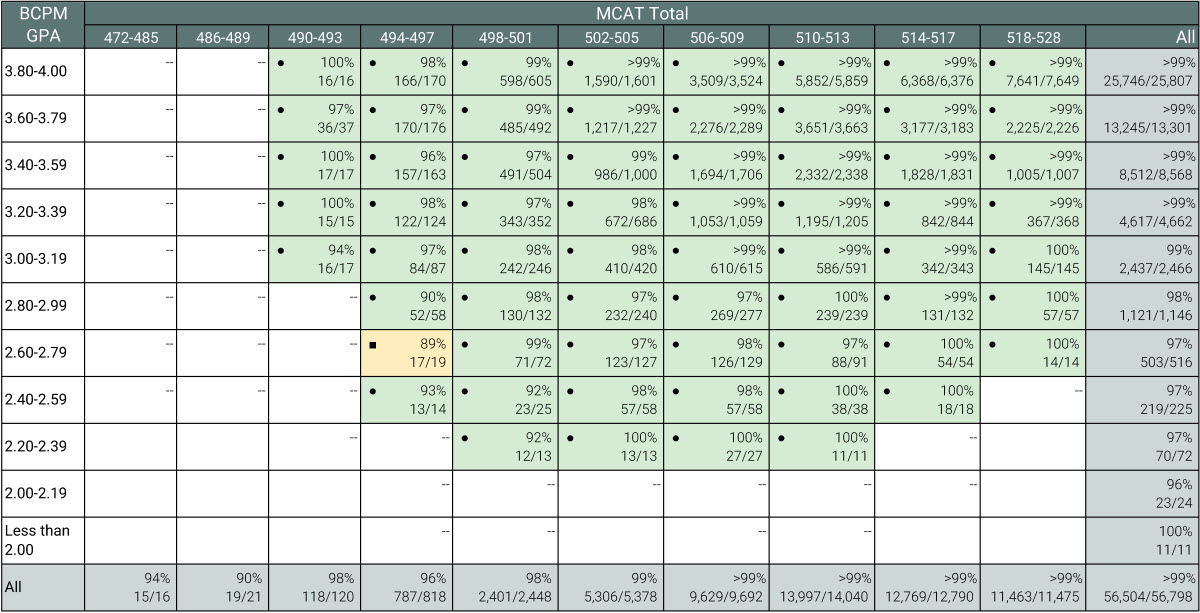
Note: Green (●) = pass rates of 90%–100%; yellow (■) = pass rates of 80%–89%; blue (▲) = pass rates of 70%–79%; white (♦) = pass rates of 69% and lower. Cells with dashes = fewer than 10 observations; blank cells = zero observations. For students who took the MCAT exam multiple times, the most recent MCAT total score was used in this analysis.
Progression to Year Three on Time: 2020, 2021, and 2022 Matriculants
Note: Green (●) = progression rates of 90%–100%; yellow (■) = progression rates of 80%–89%; blue (▲) = progression rates of 70%–79%; white (♦) = progression rates of 69% and lower. Cells with dashes = fewer than 10 observations; blank cells = zero observations. For students who took the MCAT exam multiple times, the most recent MCAT total score was used in this analysis. Students who entered medical school with advanced standing from medical, graduate, or other programs; were enrolled in joint programs (e.g., MD-PhD) at the time of matriculation or graduation; participated in special research/nonresearch studies; or are deceased are not included in this table.
Progression to Year Three With an Extra Year: 2020, 2021, and 2022 Matriculants
Note: Green (●) = progression rates of 90%–100%; yellow (■) = progression rates of 80%–89%; blue (▲) = progression rates of 70%–79%; white (♦) = progression rates of 69% and lower. Cells with dashes = fewer than 10 observations; blank cells = zero observations. For students who took the MCAT exam multiple times, the most recent MCAT total score was used in this analysis. Students who entered medical school with advanced standing from medical, graduate, or other programs; were enrolled in joint programs (e.g., MD-PhD) at the time of matriculation or graduation; participated in special research/nonresearch studies; or are deceased are not included in this table.
Graduation Within Four Years: 2018, 2019, and 2020 Matriculants
Note: Green (●) = graduation rates of 90%–100%; yellow (■) = graduation rates of 80%–89%; blue (▲) = graduation rates of 70%–79%; white (♦) = graduation rates of 69% and lower. Cells with dashes = fewer than 10 observations; blank cells = zero observations. For students who took the MCAT exam multiple times, the most recent MCAT total score was used in this analysis. Students who entered medical school with advanced standing from medical, graduate, or other programs; were enrolled in joint programs (e.g., MD-PhD) at the time of matriculation or graduation; participated in special research/nonresearch studies; or are deceased are not included in this table.
Graduation Within Five Years: 2018, 2019, and 2020 Matriculants
Note: Green (●) = graduation rates of 90%–100%; yellow (■) = graduation rates of 80%–89%; blue (▲) = graduation rates of 70%–79%; white (♦) = graduation rates of 69% and lower. Cells with dashes = fewer than 10 observations; blank cells = zero observations. For students who took the MCAT exam multiple times, the most recent MCAT total score was used in this analysis. Students who entered medical school with advanced standing from medical, graduate, or other programs; were enrolled in joint programs (e.g., MD-PhD) at the time of matriculation or graduation; participated in special research/nonresearch studies; or are deceased are not included in this table.