The Geographic Preferences section of the MyERAS® application lets applicants indicate their preference or lack of preference for geographic divisions and urban/rural settings. This year was the first year that the AAMC collected preference data from all applicants.
Reporting geographic and setting preferences empowers applicants by giving them a platform to communicate their preferences directly with programs. This firsthand information allows programs to reduce their reliance on inferences from indirect information, such as geographic proximity of an applicants’ medical school or hometown, which in turn could reduce geographic bias and provide fair opportunities to all applicants.
Here is what the preliminary data, collected as of Dec. 4, 2023, reveals:
Applicants’ Use of Geographic Preferences
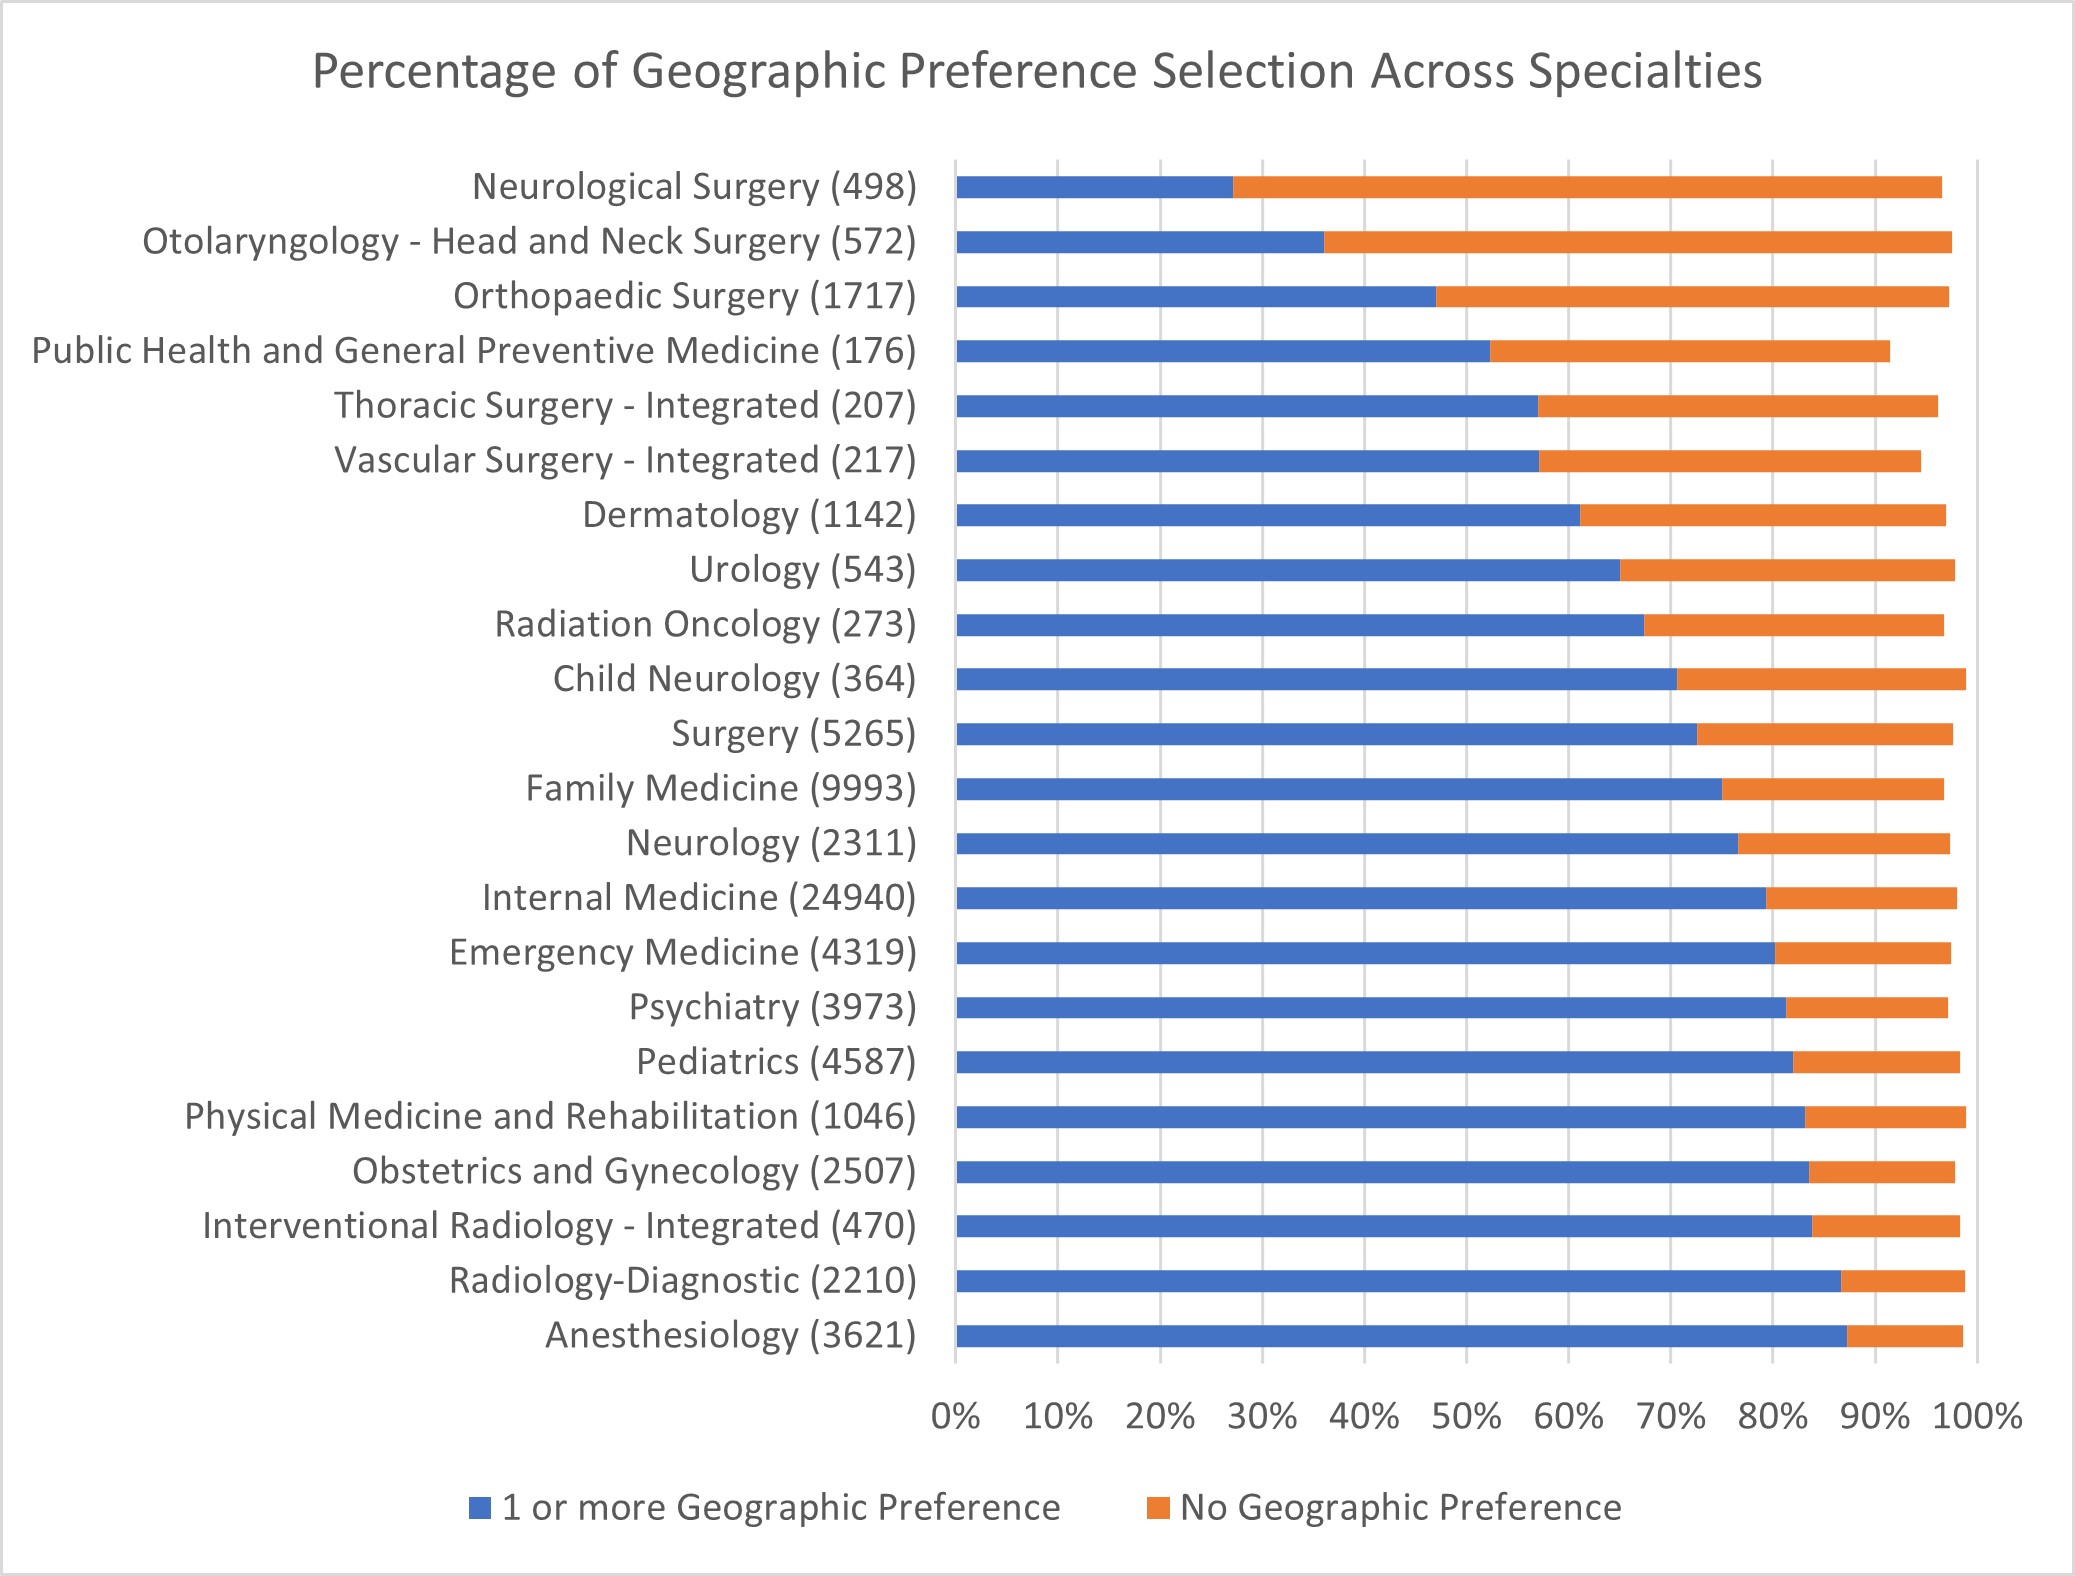
Most applicants reported a preference for at least one of the U.S. census divisions. In fact, over 50% of applicants reported a preference in 19 of 22 ERAS® program-participating specialties with at least 100 applicants, and the majority of these applicants reporting the maximum of three geographic preferences.
The exceptions were applicants to Neurosurgery, Orthopedic Surgery, and Otolaryngology, who more often leaned towards the neutrality of “No Preference.” This finding raised the question: Was this a strategic move for applicants in the face of high competition, or a reflection of these specialties’ unique guidance about how the information will be used by programs?
Exploring Reporting Geographic Preference vs. No Preference
In November 2023, the AAMC surveyed all ERAS applicants to better understand their use of geographic preferences. Respondents made up 4,288 applicants, or 11% of those who received the survey. While results should be interpreted cautiously due to low response rate, they reveal some key themes that might provide some insight into applicant thinking.
Among applicants who indicated a geographic preference, the most frequently reported factors applicants considered were “Close to family/friends” (87.5% of responses), “Location of desired program” (75.3% of responses), “Having previous ties to the region” (56.2% of responses), and “Lifestyle factors (e.g., urban/rural setting, availability of public transportation, access to outdoor activities)” (53.2% of responses), taken from 3,129 responses to this question on the applicant survey.
As in prior years, the two most popular reasons for reporting no preference across specialties were “Concern that programs would overlook my application if I did not select their division,” and “Geography is not important to me,” both of which represented a little over 50% of the 608 responses to this question.
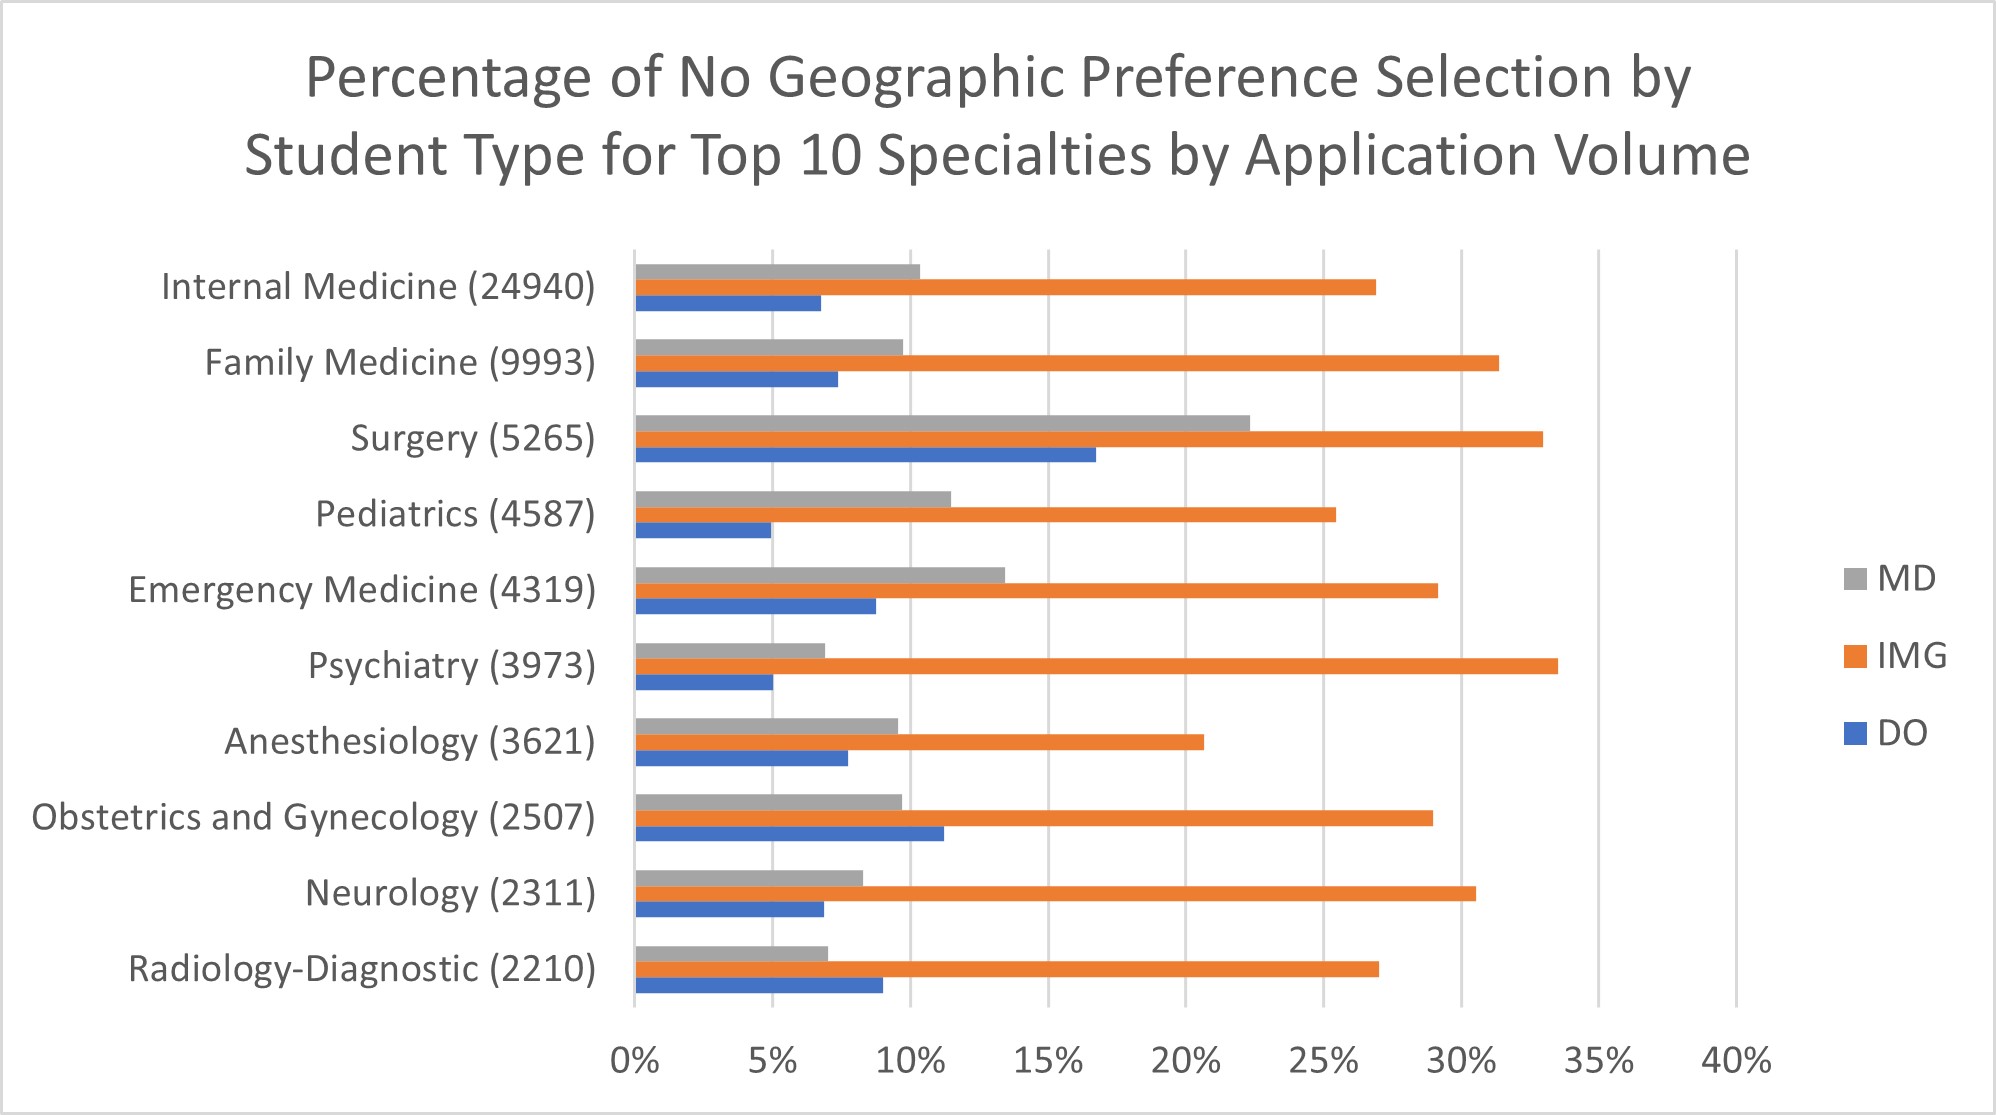
Use of Geographic Preference by International Medical Graduate (IMG) Applicants
When we examined the data by applicant type — MD, DO, or IMG — we observed additional variations. As in prior years, IMG applicants, perhaps less bound by regional ties, frequently choose No Preference at higher rates than MD and DO applicants. DO applicants, on the other hand, selected No Preference less frequently than MD applicants. In some specialties, this pattern of differences was more pronounced. For example, in Neurology, IMG applicants were more than three times as likely as MD and DO applicants to select No Preference, whereas in Dermatology, IMG and MD applicants select No Preference at similar rates.
It’s possible these applicant type differences may be linked to their familiarity with and exposure to U.S. regions. MD and DO students have generally spent more time in particular U.S. regions and may have developed preferences. IMG applicants' preferences for U.S. residency programs can be as varied as their backgrounds. Some may prioritize the opportunity itself, considering various geographic regions, while others may have specific location preferences influenced by personal or professional reasons.
Use of Geographic Preference by Applicant Race/Ethnicity
There were no differences in use of No Preference in 16 of 22 ERAS program-participating specialties, with at least 100 total applicants and 25 applicants in the comparison group. However, there was a higher percentage of either Black or Hispanic applicants who chose No Preference compared to White applicants in Dermatology, Orthopaedic Surgery, Surgery, Internal Medicine, Family Medicine, and Anesthesiology.
This broad pattern of differences in these specific specialties is consistent with what was observed in the 2023 ERAS geographic preference analyses, where non-White applicants in Dermatology and Internal Medicine selected No Preference more often than White applicants.
These findings may suggest that non-White applicants in some specialties may seek out opportunities across the U.S., regardless of location, to further their career goals in a health care landscape where they may face unique challenges and opportunities.
Use of Setting Preferences: Identifying Applicants with Interest in Serving Rural Communities
In general, a majority of applicants that completed the settings preference question selected No Preference, followed by Suburban or Urban. This finding was consistent across specialties.
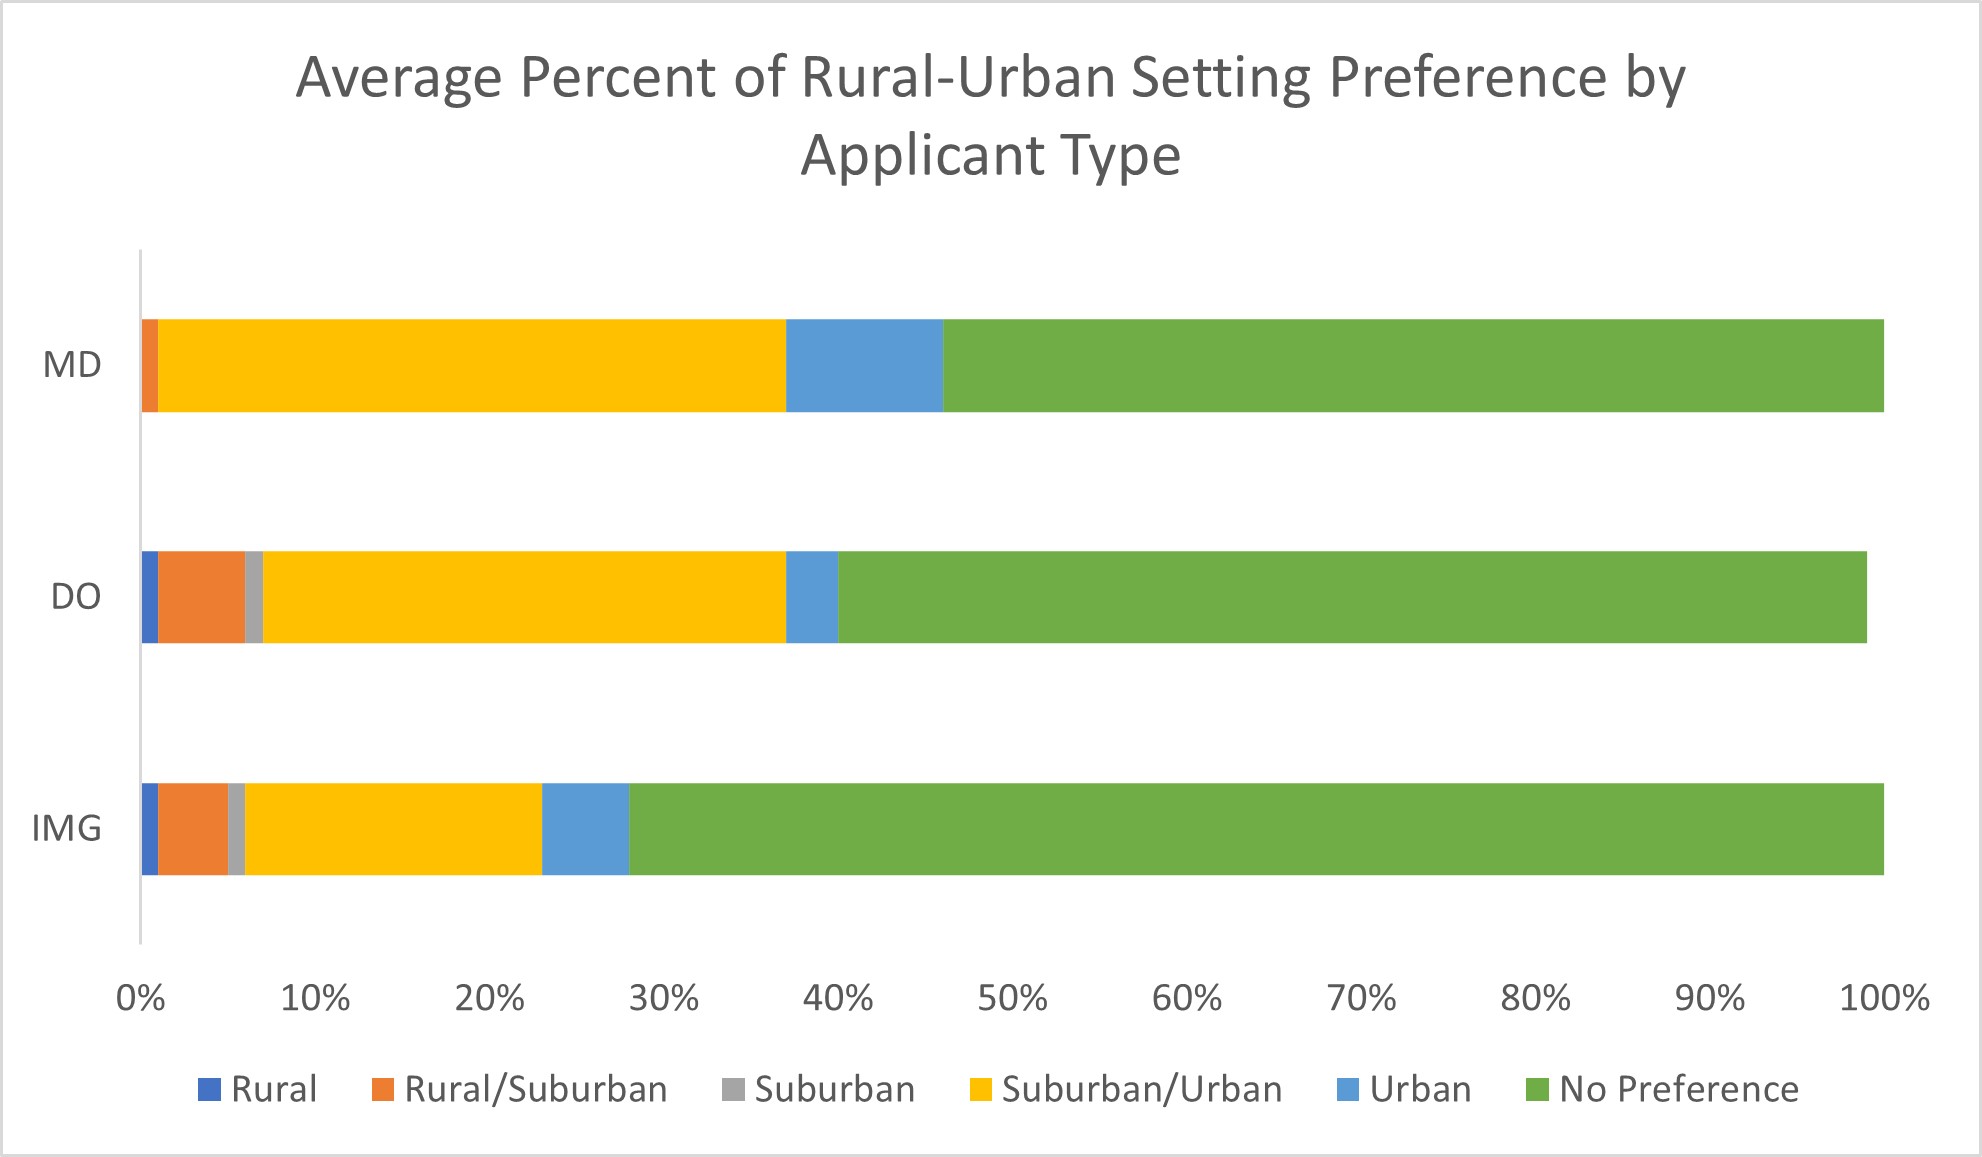
While Rural and Rural or Suburban were the least common responses, some applicants did select these choices (e.g., 1,126 Family Medicine applicants, which represents 11% of all Family Medicine applicants), which represents valuable information for program directors hoping to identify those with a preference for rural settings. Some applicants who have personal ties to communities and rural backgrounds may be especially valuable to programs looking for medical professionals who are willing to live in and serve in rural areas.
When considering student type, IMG applicants selected No Preference more often than other applicant types in many specialties and both DO and IMG applicants were more likely to select Rural/Suburban preferences compared to MD applicants.
White applicants had significantly higher rates of selecting No Preference than either Asian, Hispanic, or Black applicants in 13 of 22 specialties: Anesthesiology, Dermatology, Family Medicine, Internal Medicine, Interventional Radiology — Integrated, Neurology, Obstetrics and Gynecology, Orthopaedic Surgery, Pediatrics, Psychiatry, Radiology-Diagnostic, Surgery, and Emergency Medicine.
Visit ERAS Statistics to explore these specialty-level geographic and setting preference data and more.
Prior research showed that geographic preferences were linked to interview invitation rates, so stay tuned for more information about the relationship between geographic and setting preference and interview invitations for the 2024 cycle. The AAMC will begin to analyze how preliminary preference relates to interview conversion in February.