Figure 1

Source: National Institutes of Health. NIH RePORTER. Accessed March 22, 2026.
Figure 1 Overview
This figure contains a line graph that shows trends in NIH spending on extramural research over the course of FY 2021-2026. It shows that NIH funding in FY 2025 was markedly lower for much of the year, from February 2025 through August, although the NIH “caught up” to previous years by the end of the fiscal year. It also shows that NIH funding in FY 2026 has remained consistently lower than the previous five fiscal years, as of March 20, 2026.
Figure 1 Values (Billions)
| October | December | February | April | June | August | September | |
|---|---|---|---|---|---|---|---|
| FY 2021 | $0.10 | $2,90 | $6.30 | $12.90 | $20.90 | $29.80 | $33.50 |
| FY 2022 | $0.10 | $2.70 | $6.30 | $12.10 | $20.70 | $30.80 | $34.70 |
| FY 2023 | $0.10 | $2.60 | $7.10 | $13.10 | $21.60 | $32.00 | $35.70 |
| FY 2024 | $0.10 | $2.90 | $7.10 | $12.30 | $20.60 | $31.70 | $35.10 |
| FY 2025 | $0.10 | $3.00 | $5.60 | $10.70 | $16.00 | $29.20 | $34.40 |
| FY 2026 | $0.00 | $1.30 | $5.00 |
Figure 1 Presentation
The line chart displays the cumulative extramural funding obligated by the NIH over the course of FY 2021-2026. The x-axis represents the period through the end of each month and runs from October through September. The y-axis represents the total amount of funding obligated by the end of that month, in current U.S. dollars. The y-axis is displayed in billions and ranges from $0 to $40 billion. There are six lines on the graph, each representing a fiscal year: FY 2021, FY 2022, FY 2023, FY 2024, and FY 2025, all in gray, and FY 2026 (red). While the lines for FY 2021-2025 cover the full fiscal year, the line for FY 2026 only runs to the current date.
Figure 2

Source: National Institutes of Health. NIH RePORTER. Accessed March 22, 2026
Figure 2 Overview
This figure contains a line graph that shows trends in the number of extramural grants awarded by the NIH over the course of FY 2021-2026. It shows that the NIH awarded fewer grants in FY 2025 by the end of February 2025 through the end of the fiscal year, resulting in the NIH awarding thousands fewer grants in FY 2025, compared to FY 2021-2024. It also shows that in FY 2026, the NIH has awarded consistently fewer grants than the previous five fiscal years, as of March 20, 2026.
Figure 2 Values
|
October |
December | February | April | June | August | September | |
|---|---|---|---|---|---|---|---|
| FY 2021 | 219 | 5,653 | 12,908 | 23,356 | 39,835 | 57,622 | 63,099 |
| FY 2022 | 326 | 5,829 | 13,623 | 26,648 | 39,559 | 58,553 | 64,360 |
| FY 2023 | 174 | 5,357 | 13,679 | 25,341 | 41,082 | 60,054 | 65,388 |
| FY 2024 | 363 | 5,743 | 13,889 | 23,842 | 39,261 | 59,341 | 64,070 |
| FY 2025 | 165 | 5,881 | 11,083 | 20,168 | 29,285 | 50,978 | 57,866 |
| FY 2026 | 0 | 2,460 | 9,045 |
Figure 2 Presentation
The line chart displays the cumulative number of extramural grants awarded by the NIH over the course of the fiscal year, for FY 2021-2026. The x-axis represents the period through the end of the month and runs from October through September. The y-axis represents the total number of grants awarded by the end of the month, ranging from 0 to 75,000. There are six lines on the graph, each representing a fiscal year: FY 2021, FY 2022, FY 2023, FY 2024, and FY 2025, all in gray, and FY 2026 (red). While the lines for FY 2021-2025 cover the full fiscal year, the line for FY 2026 only runs to the current date.
Figure 3
Note: *RPGs include the following activity codes: DP1-DP5, P01, PM1, PN1, R00, R01, R03, R15, R16, R21-R23, R29, R33-R35, R37, R50, R55, R56, R61, RC1-RC4, RF1, RL1, RL2, RM1, U01, U19, U34, U3R, UA5, UC1-UC4, UC7, UF1, UG3, UH2, UH3, UH5, UM1, and UM2.
**Research training and career development awards, which include all independent training grants and institutional training grants, including F, T, and K mechanisms. Source: National Institutes of Health.
Source: National Institutes of Health. NIH RePORTER. Accessed March 22, 2026.
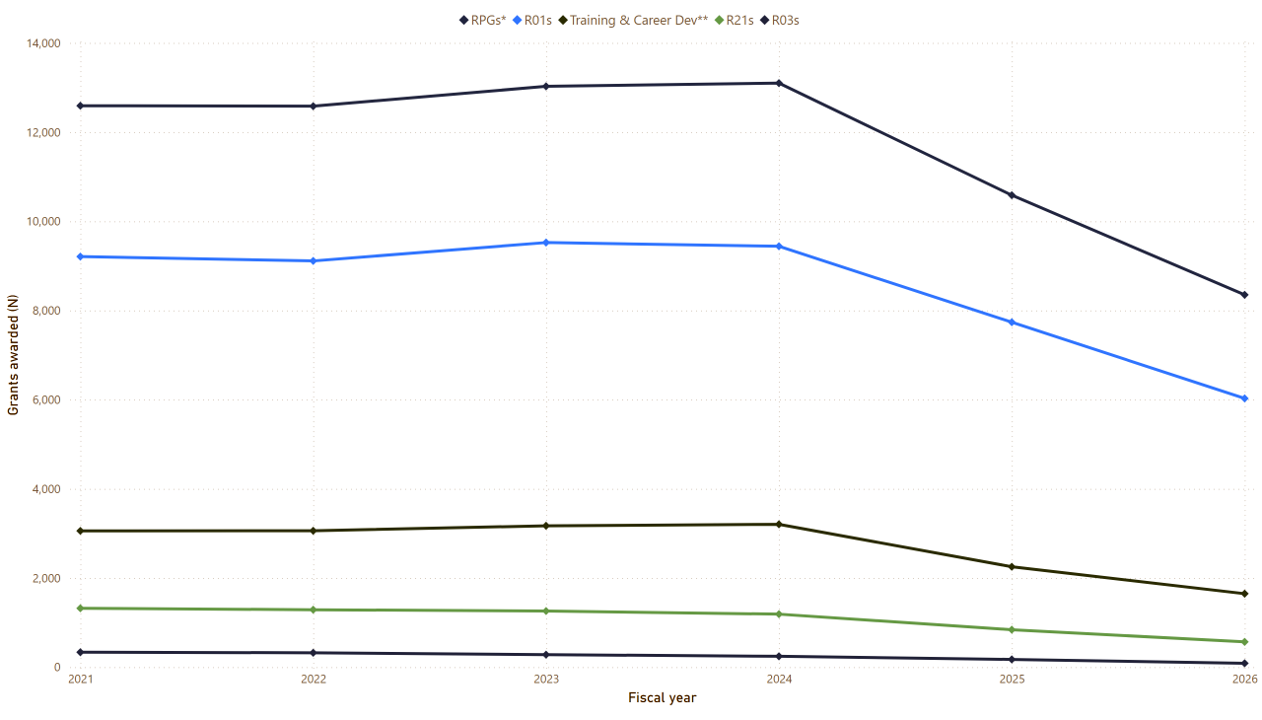
Figure 3 Overview
This figure contains a line graph that shows the number of extramural grants awarded by the NIH, by funding mechanism and fiscal year, for FY 2021-2026. Between Oct. 1 and March 20 of FY 2021-2024, the NIH awarded a similar number of RPGs, R01s, R21s, R03s, and research training and career development grants. However, the number of RPG, R01, R21, R03, and research training and career development grants awarded in the same time period in FY 2025 was lower than the previous four fiscal years, and lowest in FY 2026.
Figure 3 Values
| All RPGs | R01s | R21s | R03s | Research Training and Career Development grants | |
|---|---|---|---|---|---|
| FY 2021 | 12,591 | 9,207 | 1,320 | 334 | 3,056 |
| FY 2022 | 12,581 | 9,110 | 1,287 | 322 | 3,058 |
| FY 2023 | 13,026 | 9,522 | 1,258 | 280 | 3,170 |
| FY 2024 | 13,098 | 9,439 | 1,188 | 243 | 3,203 |
| FY 2025 | 10,584 | 7,736 | 839 | 176 | 2,251 |
| FY 2026 | 8,350 | 6,026 | 566 | 86 | 1,647 |
Figure 3 Presentation
The line chart displays the number of extramural grants awarded by the NIH between Oct. 1 and March 20 for FY 2021-2026. The x-axis represents the fiscal year and runs from FY 2021-2026. The y-axis represents the total number of grants awarded, ranging from 0 to 14,000. There are five lines on the graph, each representing a specific type of grant: RPGs (navy blue), R01s (bright blue), R21s (teal green), R03s (dark blue), and research training and career development awards (dark green).
Figure 4
Source: National Institutes of Health. NIH RePORTER. Accessed March 22, 2026
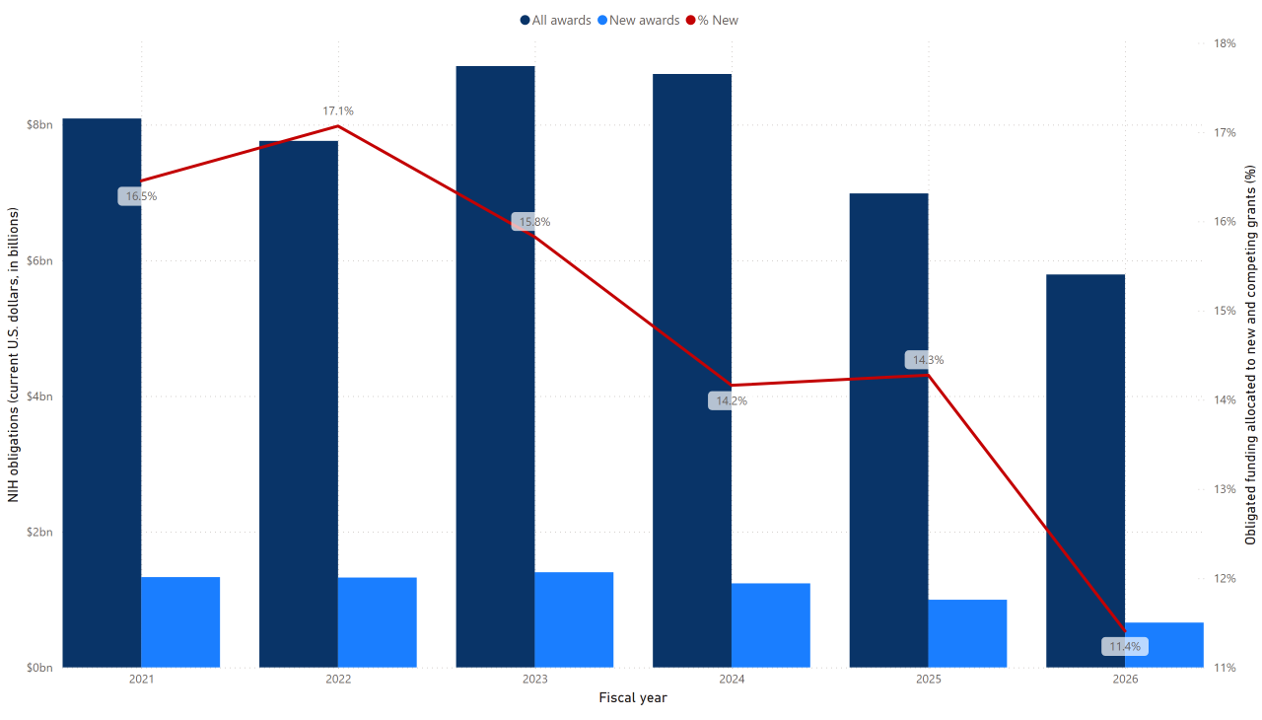
Figure 4 Overview
This figure contains a clustered bar graph and a superimposed line graph. The bar graph shows the total funding awarded to new extramural grants by the NIH and the total funding awarded to all extramural grants by the NIH, by fiscal year, for FY 2021-2026. The line graph shows the percentage of all extramural funding that was awarded to new grants. As of March 20, new grants comprise a smaller share of extramural funding obligated by the NIH in FY 2026 vs. the same period in FY 2021-2025.
Figure 4 Values
| Total cost, all grants | Total cost, new grants | New grants (%) | |
|---|---|---|---|
| FY 2021 | $8,090,010,102 | $1,331,107,836 | 17% |
| FY 2022 | $7,759,891,572 | $1,324,476,655 | 17% |
| FY 2023 | $8,862,745,568 | $1,402,609,380 | 16% |
| FY 2024 | $8,745,973,496 | $1,238,609,909 | 14% |
| FY 2025 | $6,985,718,414 | $997,280,197 | 14% |
| FY 2026 | $5,790,985,517 | $660,576,369 | 11% |
Figure 4 Presentation
The bar chart displays the total funding obligated to extramural grants — to all grants and to new grants — by the NIH between Oct. 1 and March 20, for FY 2021-2026. The x-axis represents the fiscal year and runs from FY 2021-2026. The y-axis represents the total amount of funding obligated in billions, ranging from $0 to $10 billion. There are two bars per fiscal year on the graph: all grants (navy blue) and new grants (light blue).
The line chart displays the percentage of all obligated extramural funding that was awarded to new grants. The x-axis is the same as the bar graph, representing FY 2021-2026. The y-axis represents the percentage of all obligated extramural funding awarded to new grants, ranging from 0% to 18%.
Figure 5
Source: National Institutes of Health. NIH RePORTER. Accessed March 22, 2026
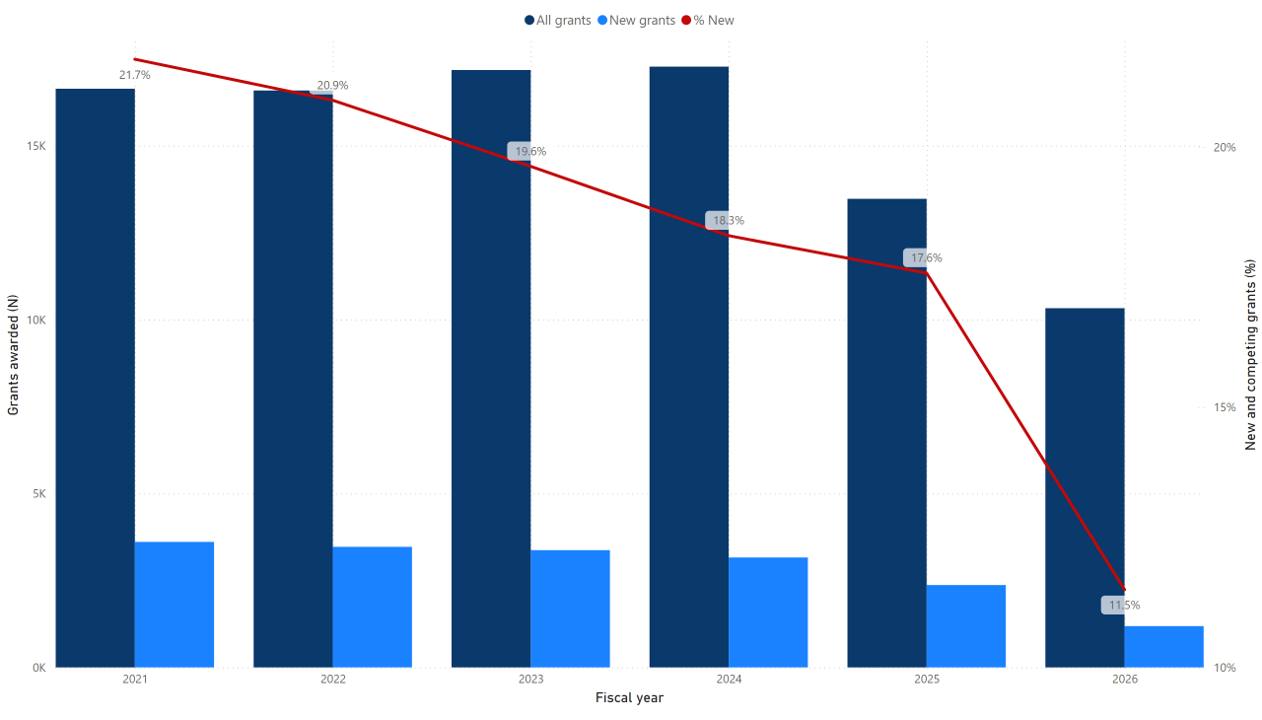
Figure 5 Overview
This figure contains a clustered bar graph and a superimposed line graph. The bar graph shows the number of new extramural grants awarded by the NIH and the total number of extramural grants awarded by the NIH, by fiscal year, for FY 2021-2026. The line graph shows the percentage of all extramural grants awarded that were new. New grants comprised a smaller share of all FY 2026 grants awarded by the NIH between Oct. 1 and March 20 compared to the share of new grants awarded in this same time frame in FY 2021-2025.
Figure 5 Values
| Total number of grants | Total number of new grants | New grants (%) | |
|---|---|---|---|
| FY 2021 | 16,637 | 3,608 | 22% |
| FY 2022 | 16,586 | 3,466 | 21% |
| FY 2023 | 17,175 | 3,371 | 20% |
| FY 2024 | 17,272 | 3,160 | 18% |
| FY 2025 | 13,472 | 2,368 | 18% |
| FY 2026 | 10,327 | 1,187 | 11% |
Figure 5 Presentation
The bar chart displays the total number of grants awarded — new grants and all grants — by the NIH between Oct. 1 and March 20, for FY 2026. The x-axis represents the fiscal year and runs from FY 2021-2026. The y-axis represents the total number of grants awarded, ranging from 0 to 18,000. There are two bars per fiscal year on the graph: all grants (dark blue) and new grants (bright blue).
The line chart displays the percentage of all grants awarded that were new grants. The x-axis is the same as the bar graph, representing FY 2021-2026. The secondary y-axis represents the percentage, ranging from 0% to 22%.
Figure 6
Note: *RPGs include the following activity codes: DP1-DP5, P01, PM1, PN1, R00, R01, R03, R15, R16, R21-R23, R29, R33-R35, R37, R50, R55, R56, R61, RC1-RC4, RF1, RL1, RL2, RM1, U01, U19, U34, U3R, UA5, UC1-UC4, UC7, UF1, UG3, UH2, UH3, UH5, UM1, and UM2.
Source: National Institutes of Health. NIH RePORTER. Accessed March 22, 2026
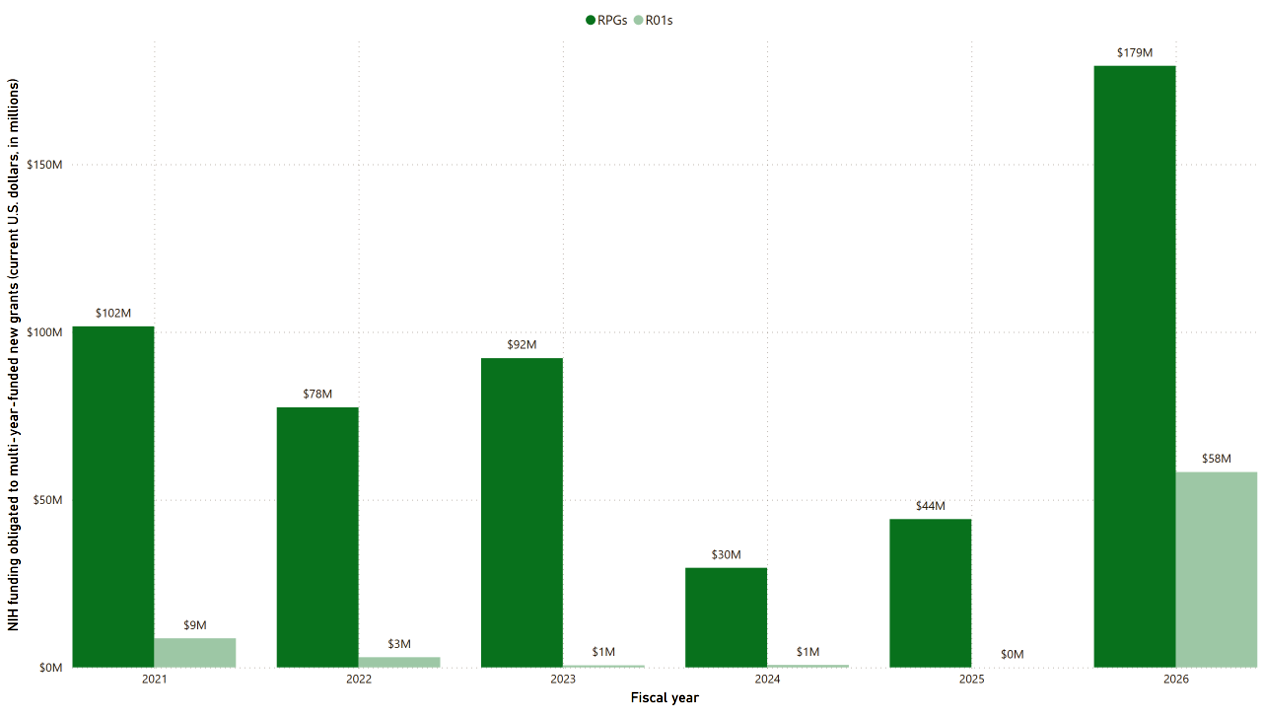
Figure 6 Overview
This figure contains a clustered bar graph. The bar graph shows the amount of funding obligated to multiyear-funded new research project grants (RPGs) and R01s, in millions, by fiscal year, for FY 2021-2026. Between Oct. 1 and March 20 of FY 2021-2025, the amount of funding awarded to MYF new RPGs and MYF new R01s was markedly less than in the same time period in FY 2026.
Figure 6 Values
| Multiyear-funded new RPGs | Multiyear-funded new R01s | |
|---|---|---|
| FY 2021 | $101,672,067 | $8,674,259 |
| FY 2022 | $77,519,029 | $3,039,194 |
| FY 2023 | $92,187,701 | $618,078 |
| FY 2024 | $29,692,382 | $734,650 |
| FY 2025 | $44,209,838 | $0 |
| FY 2026 | $179,337,358 | $58,238,102 |
Figure 6 Presentation
The clustered bar chart displays the total funding awarded to multiyear-funded new research project grants (RPGs) — to all new RPGs and to new R01s — by the NIH between Oct. 1 and March 20, for FY 2021-2026. The x-axis represents the fiscal year and runs from FY 2021-2026. The y-axis represents the total funding awarded, in millions, ranging from $0 to $180 million. There are two bars per fiscal year on the graph: RPGs (medium green) and R01s (light green).
Figure 7
Note: *RPGs include the following activity codes: DP1-DP5, P01, PM1, PN1, R00, R01, R03, R15, R16, R21-R23, R29, R33-R35, R37, R50, R55, R56, R61, RC1-RC4, RF1, RL1, RL2, RM1, U01, U19, U34, U3R, UA5, UC1-UC4, UC7, UF1, UG3, UH2, UH3, UH5, UM1, and UM2.
Source: National Institutes of Health. NIH RePORTER. Accessed March 22, 2026
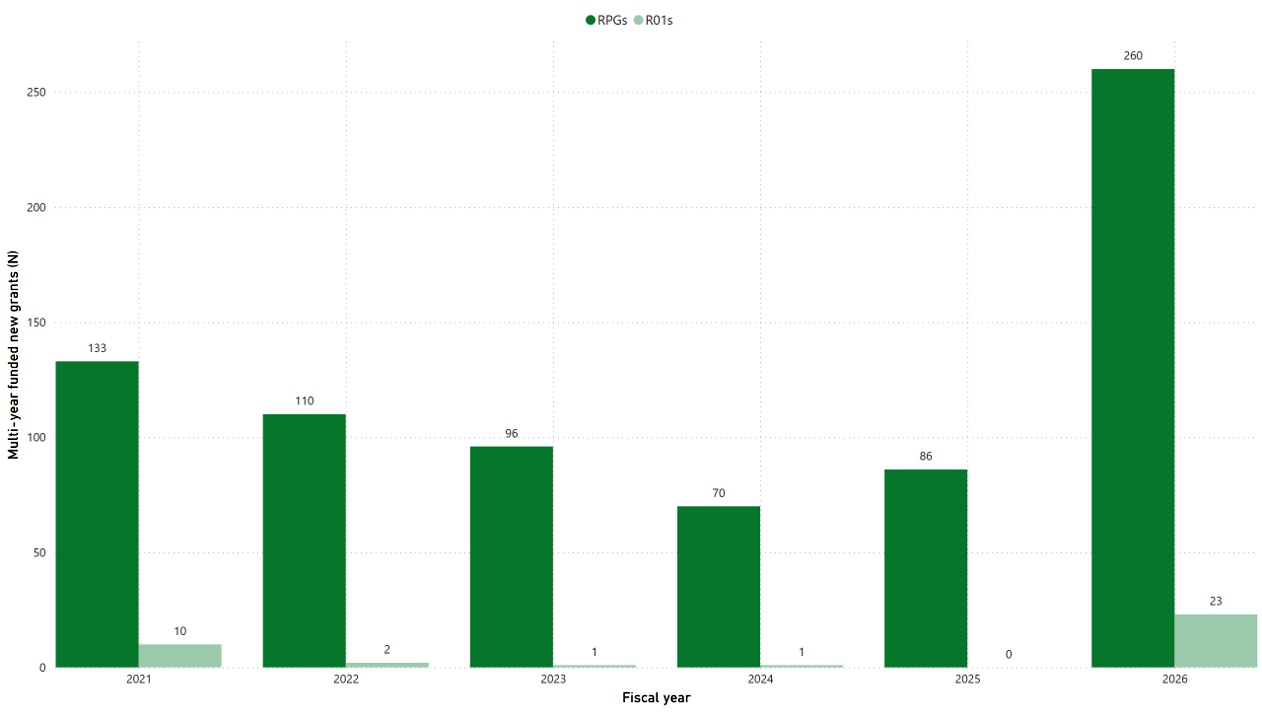
Figure 7 Overview
This figure contains a clustered bar graph. The bar graph shows the number of multiyear-funded new research project grants (RPGs) and R01s awarded, by fiscal year, for FY 2021-2026. Between Oct. 1 and March 20 of FY 2026, the number of new RPGs and R01s receiving multiyear funding was markedly higher than the totals in the same period in FY 2021-2025.
Figure 7 Values
| Multiyear-funded RPGs | Multiyear-funded R01s | |
|---|---|---|
| FY 2021 | 133 | 10 |
| FY 2022 | 110 | 2 |
| FY 2023 | 96 | 1 |
| FY 2024 | 70 | 1 |
| FY 2025 | 86 | 0 |
| FY 2026 | 260 | 23 |
Figure 7 Presentation
The clustered bar chart displays the total number of multiyear-funded new research project grants (RPGs) — all new RPGs and new R01s — awarded by the NIH between Oct. 1 and March 20 for FY 2021-2026. The x-axis represents the fiscal year and runs from FY 2021-2026. The y-axis represents the total number of MYF new grants, ranging from 0 to 260. There are two bars per fiscal year on the graph: RPGs (medium green) and R01s (light green).