Figure 1
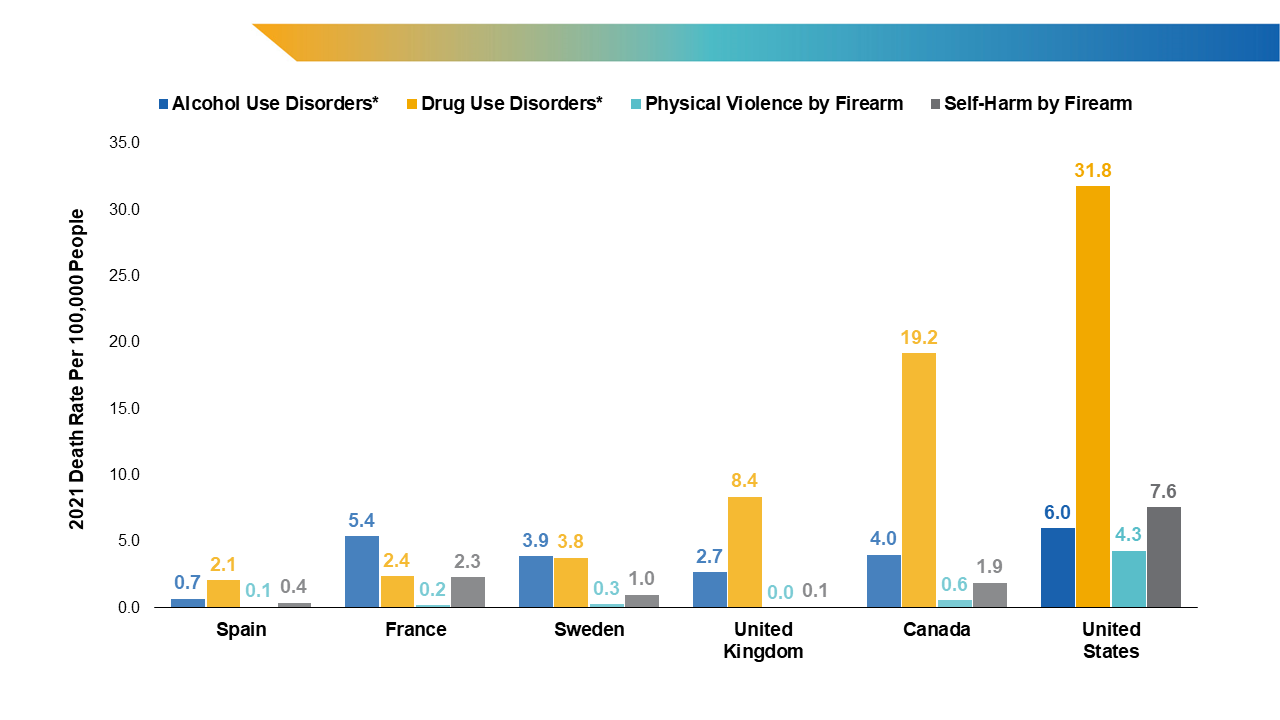
Death rates by cause of death.
* Drug use disorder deaths include all deaths by overdose of commonly misused drugs, and alcohol use disorder deaths include alcohol-induced deaths. Definitions of causes of death vary by country, see original source for more information.
Source: World Health Organization, the Global Health Observatory. Global health estimates: leading causes of death. Accessed September 12, 2024. https://www.who.int/data/gho/data/themes/mortality-and-global-health-estimates/ghe-leading-causes-o…; Institute for Health Metrics and Evaluation, Global Health Data Exchange. Global Burden of Death Study 2021 results. Accessed September 12, 2024. https://vizhub.healthdata.org/gbd-results/
Figure 1 Overview
The figure contains a bar chart that shows the death rates per 100,000 people by cause of death across seven Organization for Economic Cooperation and Development (OECD) countries in 2021. It shows that across the six comparable OECD countries of Spain, France, Sweden, Australia, the United Kingdom, and Canada, the United States has had disproportionately higher death rates from alcohol use disorders, drug use disorders, physician violence by firearm, and self-harm by firearm.
Figure 1 Values
| Spain | France | Sweden | United Kingdom | Canada | United States | |
|---|---|---|---|---|---|---|
| Alcohol Use Disorders | 0.7 | 5.4 | 3.9 | 2.7 | 4.0 | 6.0 |
| Drug Use Disorders | 2.1 | 2.4 | 3.8 | 8.4 | 19.2 | 31.8 |
| Physical Violence by Firearm | 0.1 | 0.2 | 0.3 | 0.0 | 0.6 | 4.3 |
| Self-Harm by Firearm | 0.4 | 2.3 | 1.0 | 0.1 | 1.9 | 7.6 |
Figure 1 Presentation
The bar chart represents the death rates per 100,000 people by cause of death across six Organization for Economic Cooperation and Development (OECD) countries in 2021. The x-axis represents the six OECD countries from left to right: Spain, France, Sweden, United Kingdom, Canada, and United States. The y-axis represents 2021 death rate per 100,000 people, ranging from 0.0 to 35.0. The 2021 death rate per 100,000 people is represented at the top of each bar by OECD country. Cause of death is represented for each country is represented by color from left to right: Alcohol Use Disorder (blue), Drug Use Disorder (gold), Physical Violence by Firearm (teal), and Self-Harm by Firearm (gray).